

患者病患部位的3D解剖结构模型[1]在计算机辅助诊断的定量和定性分析[2]、识别膝关节生物力学特征[3]、虚拟重建面部缺损[4]、手术规划和对齐术中导航[5-7]等诸多医学图像处理领域都有着广泛的应用. 在医学图像的处理过程中,患者病患部位的3D解剖结构模型可以帮助医生更好地将相关信息转变成可视化数据[8],以便对患者的病情做出快速、准确的判断,降低误诊的风险,有效制订后续的治疗计划. 获取患者病患部位的3D解剖结构模型的常见方法是使用成像技术,例如计算机断层扫描技术[9](computed tomography,CT)和核磁共振图像技术[10](magnetic resonance imaging,MRI). 然而,在一些偏远地区和资源有限的地区,医院通常无法使用这些技术获得患者病患部位的3D解剖结构模型[11]. 因此,用非成像技术构建患者病患部位的3D解剖结构模型成为研究热点.
在建立可变模型的过程中,统计形状模型[12]能够对解剖结构的几何变形进行参数化表示,有效地构建出可变模型. 越来越多的学者通过统计形状模型构建患者病患部位的3D解剖结构模型. Davies[13]提出在统计形状模型的构建阶段手动标记特征点,在模板样本与目标样本间粗略地建立对应关系,这样不仅耗时长还容易造成操作错误,导致构建的3D模型性能较差. Kelemen等[14]提出球谱函数描述法(spherical harmonics descriptors method,SPHARM)并用该方法构建出患者病患部位的3D解剖结构模型,但是构建模型的训练样本只适用于球体. Eck等[15]采用基于球谐函数的3D强度模型分析异染色质焦点的形状和强度,将统计模型与图像强度模型拟合确定最终的模型参数. 与此同时,Davies等[16]提出最小描述长度法(minimum description length,MDL),通过Euclidean距离计算3D模型与测试样本间的距离完成二者的拟合. 但是在构建模型的过程中需要对每个训练样本手动标记特征点,操作过程复杂且拟合效果较差,不能满足临床应用需求. Perez等[17]提出标记点滑动法(landmark sliding method,SLIDE),在MDL手动标记特征点的基础上,将初始特征点沿切线方向移动. 但SLIDE需要不断计算每个特征点的切线方向,计算过程复杂并且仅适用在特征点数量较少的图像的情况下.
针对传统建模方法不能有效构建拟合误差较小的3D模型,本研究提出基于点分布模型(point distribution model,PDM)的3D模型拟合方法(3D model fitting method based on PDM, 3DMFB-PDM). 通过引入附加项和转换非线性方程组,使点分布模型与测试样本具有最小的拟合误差.
1. 相关知识
1.1. 相关概念
训练样本集是指感兴趣区域的3D模型集合. 本研究将感兴趣区域从原始的2D CT扫描图像中分割出来,再将每个2D的感兴趣区域图像用3D模型表示,所有感兴趣区域的3D模型集合构成训练样本集. 模板样本是指从训练样本集中任意选择的单个3D模型. 测试样本是指根据患者病患部位的几何数据形成的3D点云模型. 这些几何数据可以有效表征患者病患部位的3D形态,通过3D位置传感器将患者病患部位的几何数据形成2D图像,再对2D图像进行数据处理,将2D图像以3D点云形式表示. 获取测试样本实际上就是获取患者病患部位的几何数据,使用跟踪探针来数字化在手术过程中暴露的病患部位和解剖标志区域. 在这个过程中,通常将单个3D位置传感装置连接到跟踪探头上,并通过跟踪探头捕捉的几何数据形成患者病患部位的图像,这些几何数据定义了每个图像相对于患者所在坐标系的3D位置和方向. 点分布模型是指训练样本集中的3D模型经过对齐、建立对应关系、主成分分析等过程后最终生成的3D模型,即3D点云模型.
1.2. 点分布模型
作为统计形状模型,点分布模型是基于对应点位置的变形模型. 模型的基本思想是从训练样本中提取关键点,用其坐标构成的特征向量描述目标样本,通过训练样本获得目标样本的统计信息.
假设
用正态分布
式中:
通过统计的方法生成
式中:
当
式中:
1.3. 存在的问题
在完成训练样本的点分布模型构建之后,须拟合点分布模型与测试样本,即在点分布模型中寻找与测试样本中特征点对应的点,并优化两者间的距离,使点分布模型逐渐适应患者的解剖结构. 在拟合过程中,先将点分布模型进行旋转和平移,使点分布模型与测试样本对齐;再用Euclidean距离计算测试样本特征点与点分布模型对应点间的距离,使间距最小.
假设点分布模型通过旋转变换
在点分布模型和测试样本拟合时,须对齐点分布模型和测试样本,以减小二者在形状和位置上的差异. 采用普氏分析(procrustes analysis,PA)[20]进行对齐操作,其中
用目标函数
式中:
式中:
最小化
2. 3DMFB-PDM
为了解决
式中,
令目标函数
式中:
式中:
目标函数
结果可以由线性方程组的形式表示为
通过正交分解即可求得未知参数
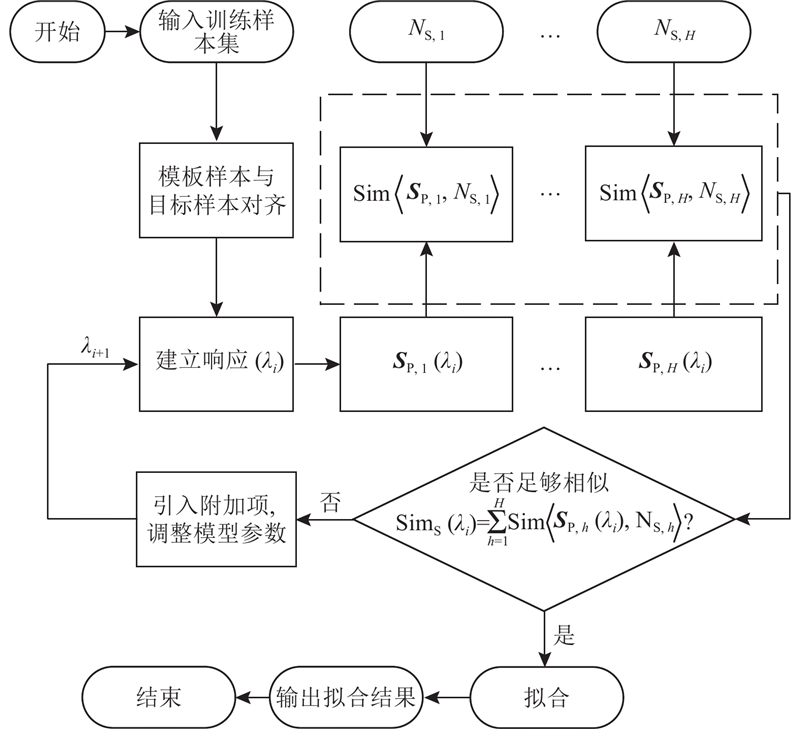
3DMFB-PDM的建模与拟合过程如图1所示,
图 1
3. 实验验证
3.1. 通用性验证
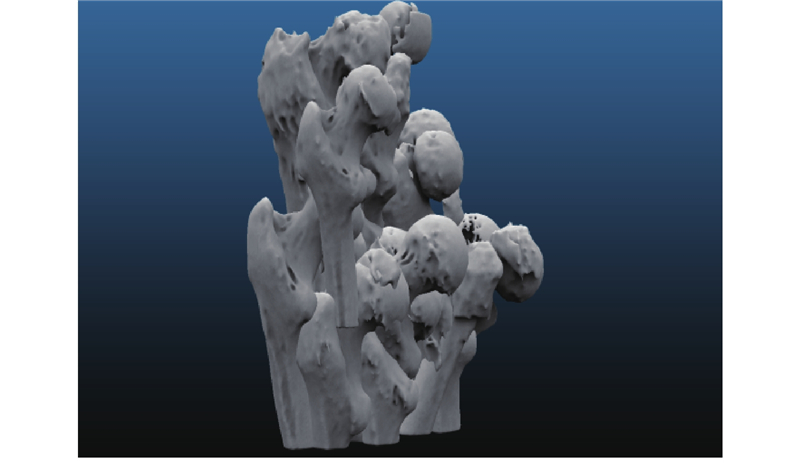
图 2
给定含有30组左侧股骨的训练样本集
表 1 30组左侧股骨图像的人体测量学信息
Tab.1
| ID | 年龄 | 性别 | W/kg | H/cm | F/n | V |
| 001 | 25 | 男 | 61 | 175 | 102 080 | 51 042 |
| 002 | 29 | 男 | 72 | 180 | 98 744 | 49 370 |
| 003 | 32 | 男 | 70 | 167 | 87 876 | 43 940 |
| 004 | 26 | 男 | 66 | 165 | 109 528 | 54 752 |
| 005 | 26 | 男 | 63 | 170 | 112 800 | 56 410 |
| 006 | 29 | 男 | 80 | 180 | 106 268 | 53 130 |
| 007 | 30 | 男 | 83 | 176 | 156 348 | 78 176 |
| 008 | 35 | 男 | 79 | 175 | 117 744 | 58 876 |
| 009 | 32 | 男 | 75 | 170 | 97 116 | 48 560 |
| 010 | 32 | 男 | 80 | 168 | 76 204 | 38 110 |
| 011 | 27 | 男 | 62 | 166 | 114 452 | 57 224 |
| 012 | 26 | 男 | 60 | 181 | 99 548 | 49 770 |
| 013 | 30 | 男 | 80 | 182 | 95 536 | 47 760 |
| 014 | 33 | 男 | 83 | 178 | 99 512 | 49 746 |
| 015 | 30 | 男 | 85 | 179 | 92 184 | 46 084 |
| 016 | 42 | 女 | 65 | 159 | 95 432 | 47 708 |
| 017 | 40 | 女 | 62 | 158 | 88 288 | 44 140 |
| 018 | 41 | 女 | 62 | 162 | 56 244 | 28 120 |
| 019 | 36 | 女 | 60 | 163 | 80 476 | 40 236 |
| 020 | 34 | 女 | 61 | 172 | 93 272 | 46 640 |
| 021 | 26 | 女 | 58 | 173 | 91 248 | 45 600 |
| 022 | 24 | 女 | 56 | 170 | 107 988 | 53 988 |
| 023 | 31 | 女 | 56 | 160 | 110 216 | 54 922 |
| 024 | 30 | 女 | 57 | 161 | 88 268 | 44 114 |
| 025 | 25 | 女 | 45 | 167 | 8 840 | 4 432 |
| 026 | 26 | 女 | 40 | 168 | 87 296 | 43 648 |
| 027 | 28 | 女 | 46 | 166 | 123 404 | 61 698 |
| 028 | 30 | 女 | 61 | 159 | 86 020 | 43 024 |
| 029 | 38 | 女 | 65 | 158 | 102 688 | 51 344 |
| 030 | 40 | 女 | 60 | 163 | 89 912 | 44 960 |
图 3
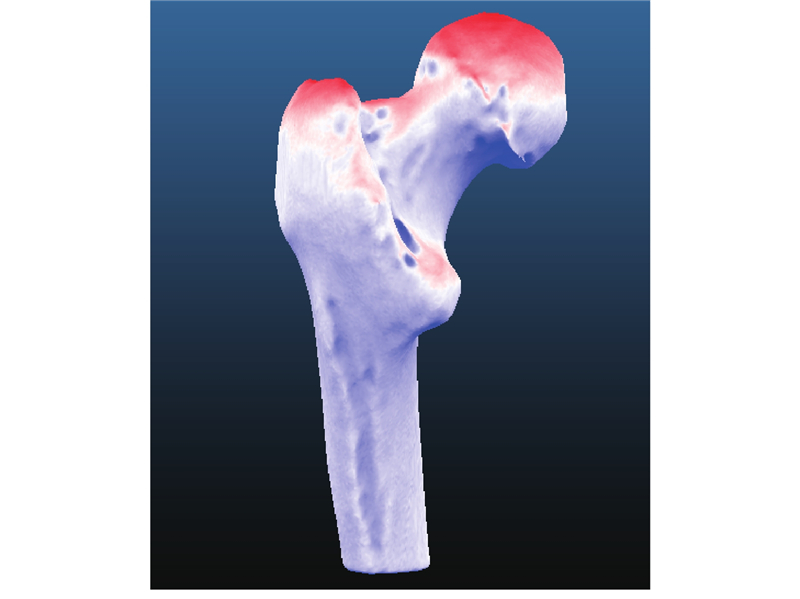
图 4
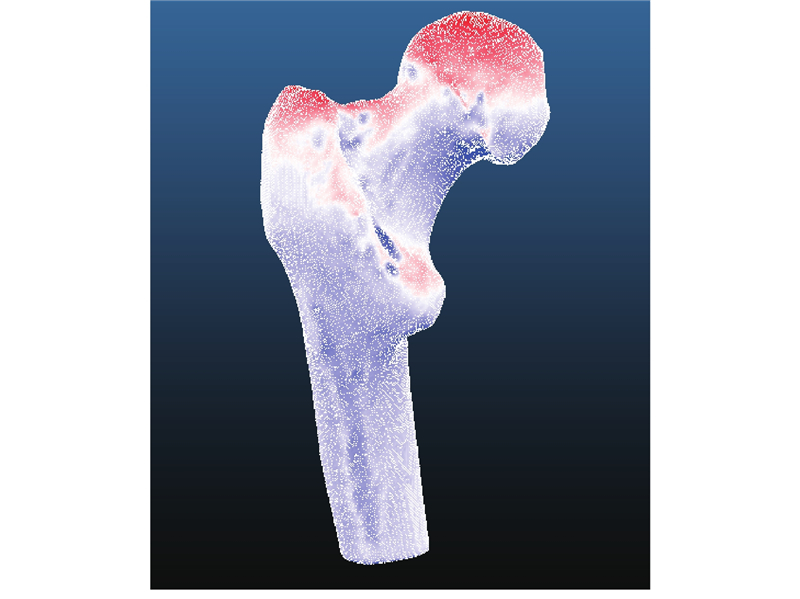
图 5
由式(7)、(8)可知,特征向量的取值对应变形模型的取值,并且点分布模型可以由前
图 6
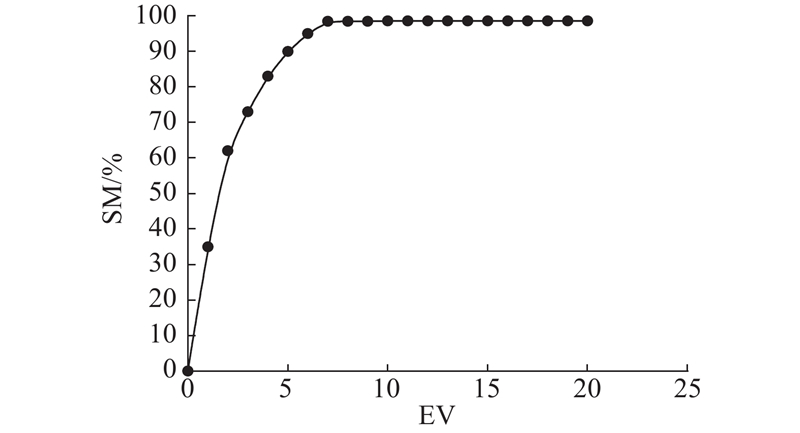
图 6 特征向量表征变形模型的百分比
Fig.6 Eigenvectors represent percentage of deformation models
3.2. 拟合误差评估
在判断距离是否达到最小时,根据图1中的相似度量函数判断
给
设定
为了评估
表 2 未引入附加项与引入附加项的误差比较
Tab.2
| 评价指标 | Max | Mean | RMS |
| mm | |||
| ED | 14.357 | 2.433 | 3.328 |
| (ED+MD) | 12.268 | 2.429 | 3.114 |
表 3 点分布模型与多个测试样本的误差比较
Tab.3
| 评价指标 | ED | (ED+MD) | |||||
| Max | Mean | RMS | Max | Mean | RMS | ||
| mm | |||||||
| 样本1 | 15.227 | 3.064 | 4.025 | 13.046 | 3.015 | 3.633 | |
| 样本2 | 14.629 | 2.921 | 3.359 | 12.437 | 2.437 | 3.217 | |
| 样本3 | 13.753 | 2.735 | 3.016 | 12.067 | 2.361 | 3.024 | |
| 样本4 | 15.664 | 2.863 | 3.968 | 12.821 | 2.501 | 3.208 | |
表 4 不同方法构建点分布模型的时间对比
Tab.4
为了比较
表 5 4种方法的误差比较
Tab.5
表 6 4种方法在3个测试样本下的拟合误差
Tab.6
| 方法 | 样本2 | 样本3 | 样本4 | ||||||||
| Max | Mean | RMS | Max | Mean | RMS | Max | Mean | RMS | |||
| mm | |||||||||||
| 文献[15] | 13.965 | 3.974 | 4.261 | 14.217 | 4.233 | 4.037 | 14.368 | 4.725 | 4.479 | ||
| 文献[18] | 12.174 | 2.316 | 3.216 | 12.537 | 2.518 | 3.168 | 12.265 | 2.241 | 3.092 | ||
| 文献[19] | 13.962 | 3.114 | 3.512 | 13.379 | 2.983 | 3.428 | 13.315 | 3.016 | 3.374 | ||
| 3DMFB-PDM | 12.037 | 2.165 | 3.191 | 12.366 | 2.401 | 3.037 | 12.117 | 2.235 | 2.894 | ||
3.3. 模型性能评估
为了进一步评估3DMFB-PDM构建的点分布模型的性能,将文献[15]、[18]、[19]方法与3DMFB-PDM进行对比验证,并将模型的紧凑性、特异性和通用性作为评价指标. 紧凑性[26](compactness)表示用尽可能少的主要变形模型表征整个点分布模型的变形能力,它被定义为对应于变形模型的特征值的累积. 特异性[27](specificity)表示模型生成的样本与训练样本集中的样本间的相似程度,它被定义为创建的形状样本与训练样本集中最相似的形状样本间的平均拟合误差. 通用性[28](generality)是模型生成未由训练样本集中明确提供的样本的能力,它被定义为遗漏训练样本集中的样本,用训练样本集中的剩余样本构建模型,计算构建的模型和遗漏的样本间的拟合误差. 通常来说,紧凑性、特异性和通用性的值越小,模型的性能越好. 4种方法构建点分布模型的性能对比结果如图7所示. 图中,DM为变形模型的个数,C、S、G分别为紧凑性、特异性和通用性表征的指标. 由图可知,文献[15]、[19]方法紧凑性明显差于文献[18]方法和3DMFB-PDM,文献[18]方法紧凑性则略差于3DMFB-PDM;3DMFB-PDM的特异性明显优于其他3种方法;文献[15]方法的通用性最差,文献[18]、[19]方法的通用性接近,3DMFB-PDM的通用性明显优于其他3种方法. 上述结果表明,3DMFB-PDM构建的点分布模型具有较好的性能.
图 7

图 7 4种方法构建的点分布模型的模型性能对比
Fig.7 Performance comparison of point distribution model constructed by four methods
4. 结 语
将Mahalanobis距离作为附加项引入计算患者病患部位的3D解剖结构模型与测试样本的最小距离过程中,提出基于点分布模型的3D模型拟合方法. 该方法通过引入Mahalanobis距离,将非线性方程组转换为线性方程组求解,同时判断点分布模型与测试样本距离是否最小,调整点分布模型的形状参数,使患者病患部位的3D解剖结构模型与测试样本间的拟合误差最小,解决传统方法构建的患者病患部位3D解剖结构模型与测试样本拟合效果较差的问题. 实验结果表明,3DMFB-PDM能够有效地将3D模型与测试样本拟合. 在计算3D模型与测试样本的拟合误差时,本研究采用最大误差、平均误差、均方根误差和相似性系数衡量拟合程度,这在大程度上依赖于3D模型与测试样本的最小距离计算. 计算二者的最小距离的过程较为烦琐且耗时. 未来将会研究如何尽可能的简化计算3D模型与测试样本的最小距离的过程,在保证二者之间的距离最小的同时简化计算的复杂度.
参考文献
Patient-specific 3D printed model of biliary ducts with congenital cyst
[J].DOI:10.21037/qims.2018.12.01 [本文引用: 1]
Group-wise similarity registration of point sets using Student’s t-mixture model for statistical shape models
[J].
The effect of articular geometry features identified using statistical shape modelling on knee biomechanics
[J].
Virtual reconstruction of bilateral midfacial defects by using statistical shape modeling
[J].DOI:10.1016/j.jcms.2019.03.027 [本文引用: 1]
Statistical shape modeling characterizes three-dimensional shape and alignment variability in the lumbar spine
[J].
The use of 3-dimensional, virtual reality models for surgical planning of robotic partial nephrectomy
[J].
Three-dimensional modelling of femur bone using various scanning systems for modelling of knee implant and virtual aid of surgical planning
[J].
Mesoscopic modeling method of concrete based on statistical analysis of CT images
[J].
In vivo assessment of thoracic vertebral shape from MRI data using a shape model
[J].DOI:10.1016/j.jspd.2018.10.005 [本文引用: 1]
Review of 2-D/3-D reconstruction using statistical shape and intensity models and X-ray image synthesis: toward a unified framework
[J].DOI:10.1109/RBME.2018.2876450 [本文引用: 1]
Statistical shape model reconstruction with sparse anomalous deformations: application to intervertebral disc herniation
[J].
Elastic model-based segmentation of 3-D neuroradiological data sets
[J].DOI:10.1109/42.811260 [本文引用: 1]
A spherical harmonics intensity model for 3D segmentation and 3D shape analysis of heterochromatin foci
[J].
Differences between sliding semi-landmark methods in geometric morphometrics, with an application to human craniofacial and dental variation
[J].DOI:10.1111/j.1469-7580.2006.00576.x [本文引用: 1]
Virtual reconstruction of glenoid bone defects using a statistical shape model
[J].DOI:10.1016/j.jse.2017.07.026 [本文引用: 15]
Femur finite element model instantiation from partial anatomies using statistical shape and appearance models
[J].
Landmark-based statistical procrustes analysis in the examination of breast shape and symmetry
[J].
Gaussian process morphable models
[J].DOI:10.1109/TPAMI.2017.2739743 [本文引用: 1]
Non-rigid free-form 2D–3D registration using a B-spline-based statistical deformation model
[J].DOI:10.1016/j.patcog.2016.09.036 [本文引用: 1]
中文文档自动分类系统的设计与实现
[J].
The design and implementation of an automatic Chinese documents classification system
[J].
Rock: a robust clustering algorithm for categorical attributes
[J].
An automated statistical shape model developmental pipeline: application to the human scapula and humerus
[J].
