|
|
|
| 3D model fitting method based on point distribution model |
Zhu-ye XU1( ),Xiao-qiang ZHAO1,2,3,*(),Hong-mei JIANG1,2,3 ),Xiao-qiang ZHAO1,2,3,*(),Hong-mei JIANG1,2,3 |
1. College of Electrical and Information Engineering, Lanzhou University of Technology, Lanzhou 730050, China
2. Key Laboratory of Gansu Advanced Control for Industrial Process, Lanzhou University of Technology, Lanzhou 730050, China
3. National Experimental Teaching Center of Electrical and Control Engineering, Lanzhou University of Technology, Lanzhou 730050, China |
|
|
|
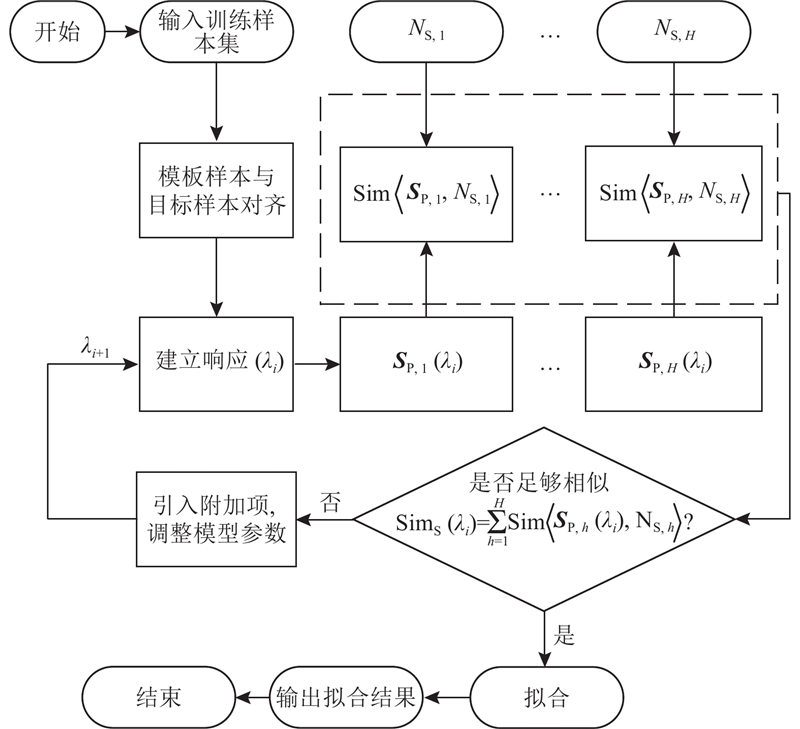
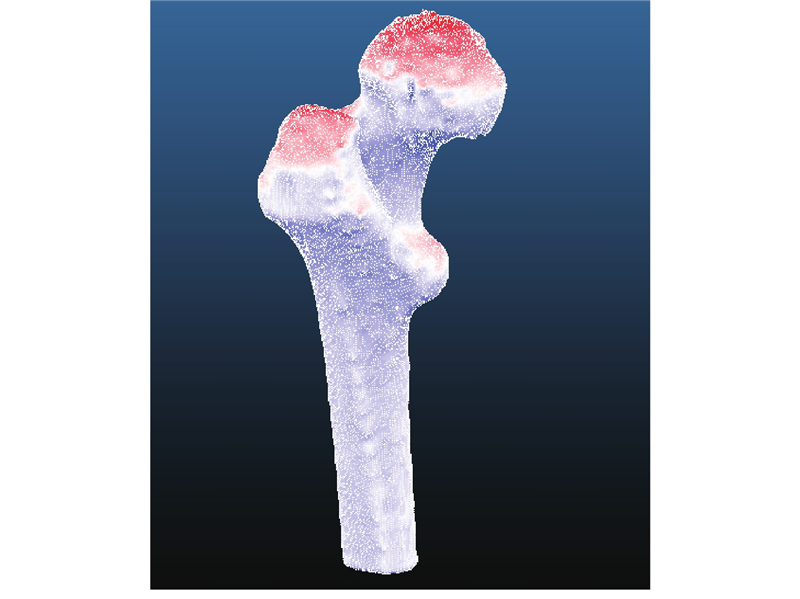
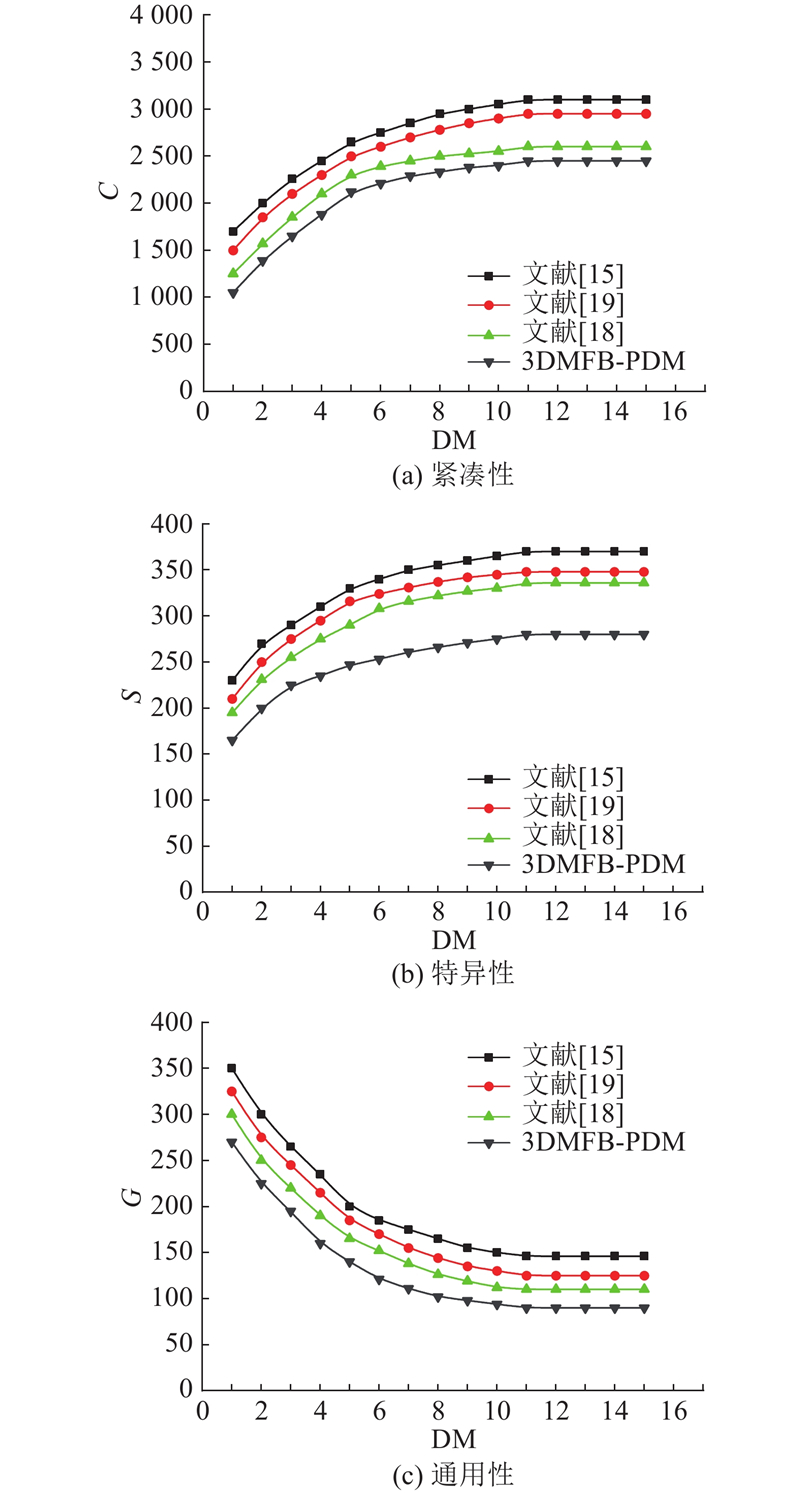
Abstract A 3D model fitting method based on point distribution model (3DMFB-PDM) was proposed, aiming at the problem of poor fitting between the 3D anatomical structure model of the patient’s part constructed by the traditional method and the test samples. Firstly, the data processing was performed on the training sample set to align the template sample with the target sample, and the adverse effects of training sample due to rotation and scale changes were alleviated. Then the correspondence among training samples was established, and the patient’s point distribution model with a normal distribution was represented. Finally, the distance between the feature point and the corresponding point in the point distribution model was calculated. By introducing the Mahalanobis distance and converting the nonlinear equations were to minimize the distance. Meanwhile, the shape parameters of the point distribution model were continuously adjusted according to the minimum distance, thus the point distribution model was fitted to the test samples. 30 groups of left femurs were selected as the training sample set for experimental verification to verify the effectiveness of 3DMFB-PDM. Results show that the fitting error after introducing additional terms is smaller than the fitting error without introducing additional terms. Comparing 3DMFB-PDM with the other three methods shows that the fitting error of 3DMFB-PDM is the smallest, which indicate that 3DMFB-PDM can effectively fit the 3D anatomical structure model of the patient’s part to the test samples.
|
|
Received: 05 January 2021
Published: 31 December 2021
|
|
|
| Fund: 国家自然科学基金资助项目 (61763029,61873116);国防基础科研项目(JCKY2018427C002) |
|
Corresponding Authors:
Xiao-qiang ZHAO
E-mail: 1820481286@qq.com;xqzhao@lut.cn
|
基于点分布模型的3D模型拟合方法
针对传统方法构建的患者病患部位的3D解剖结构模型与测试样本拟合效果较差的问题,提出基于点分布模型的3D模型拟合方法(3DMFB-PDM). 对训练样本集进行数据处理,使模板样本与目标样本对齐,减小训练样本由于旋转及尺度变化产生的不利影响;在训练样本间建立对应关系,用正态分布表示患者的点分布模型;计算测试样本中的特征点与点分布模型中对应点间的距离,通过引入Mahalanobis距离和转换非线性方程组,使点间距最小.根据最小间距不断调整点分布模型的形状参数,使点分布模型与测试样本拟合.选取30组左侧股骨作为训练样本集实验验证3DMFB-PDM的有效性,结果表明引入附加项后的拟合误差小于未引入附加项的拟合误差. 将 3DMFB-PDM与其他3种方法进行对比,结果显示3DMFB-PDM的拟合误差最小,表明3DMFB-PDM能够有效地将患者病患部位的3D解剖结构模型与测试样本拟合.
关键词:
医学图像处理,
3D建模,
形状分析,
点分布模型,
Mahalanobis距离
|
|
| [1] |
ALLAN A, KEALLEY C, SQUELCH A, et al Patient-specific 3D printed model of biliary ducts with congenital cyst[J]. Quantitative Imaging in Medicine and Surgery, 2019, 9 (1): 86- 93
doi: 10.21037/qims.2018.12.01
|
|
|
| [2] |
RAVIKUMAR N, GOOYA A, CIMEN S, et al Group-wise similarity registration of point sets using Student’s t-mixture model for statistical shape models[J]. Medical Image Analysis, 2018, 44 (2): 156- 176
|
|
|
| [3] |
CLOUTHIER A L, SMITH C R, VIGNOS M F, et al The effect of articular geometry features identified using statistical shape modelling on knee biomechanics[J]. Medical Engineering and Physics, 2019, 66 (4): 47- 55
|
|
|
| [4] |
MARC A F, STEFFEN S, JOERG N, et al Virtual reconstruction of bilateral midfacial defects by using statistical shape modeling[J]. Journal of Cranio-Maxillofacial Surgery, 2019, 47 (7): 1054- 1059
doi: 10.1016/j.jcms.2019.03.027
|
|
|
| [5] |
HOLLENBECK J F M, CAIN C M, FATTOR J A, et al Statistical shape modeling characterizes three-dimensional shape and alignment variability in the lumbar spine[J]. Journal of Biomechanics, 2018, 69 (3): 146- 155
|
|
|
| [6] |
SHIRK J D, KWAN L, SAIGAL C The use of 3-dimensional, virtual reality models for surgical planning of robotic partial nephrectomy[J]. Urology, 2019, 125 (3): 92- 97
|
|
|
| [7] |
SINDHU V, SOUNDARAPANDIAN S Three-dimensional modelling of femur bone using various scanning systems for modelling of knee implant and virtual aid of surgical planning[J]. Measurement, 2019, 141 (7): 190- 208
|
|
|
| [8] |
徐泽楷. 稀缺样本下基于深度学习的图像超分辨率方法研 究 [D]. 武汉: 华中科技大学, 2019: 11-21.
XU Ze-kai. Research on deep learning image super resolution sparse samples [D]. Wuhan: Huazhong University of Science and Technology, 2019: 11-21.
|
|
|
| [9] |
LIU T, QIN S, ZOU D, et al Mesoscopic modeling method of concrete based on statistical analysis of CT images[J]. Construction and Building Materials, 2018, 192 (12): 429- 441
|
|
|
| [10] |
MEAKIN J R, HOPKINS S J, CLARKE A In vivo assessment of thoracic vertebral shape from MRI data using a shape model[J]. Spine Deformity, 2019, 7 (4): 517- 524
doi: 10.1016/j.jspd.2018.10.005
|
|
|
| [11] |
REYNEKE C J F, LÜTHI M, BURDIN V, et al Review of 2-D/3-D reconstruction using statistical shape and intensity models and X-ray image synthesis: toward a unified framework[J]. IEEE Reviews in Biomedical Engineering, 2019, 12: 269- 286
doi: 10.1109/RBME.2018.2876450
|
|
|
| [12] |
NEUBERT A, FRIPP J, ENGSTROM C, et al Statistical shape model reconstruction with sparse anomalous deformations: application to intervertebral disc herniation[J]. Computerized Medical Imaging and Graphics, 2015, 46 (12): 11- 19
|
|
|
| [13] |
DAVIES R H. Learning shape: optimal models for analysing natural variability [D]. Manchester: University of Manchester, 2002: 34-40.
|
|
|
| [14] |
KELEMEN A, SZEKELY G, GERIG G Elastic model-based segmentation of 3-D neuroradiological data sets[J]. IEEE Transactions on medical Imaging, 1999, 18 (10): 828- 839
doi: 10.1109/42.811260
|
|
|
| [15] |
ECK S, WORZ S, MULLEROTT K, et al A spherical harmonics intensity model for 3D segmentation and 3D shape analysis of heterochromatin foci[J]. Medical Image Analysis, 2016, 32 (8): 18- 31
|
|
|
| [16] |
DAVIES R H, COOTES T F, TAYLOR C J. A minimum description length approach to statistical shape modelling [M]// INSANA M F, LEAHY R M. Information processing in medical imaging. [S.l.]: Springer, 2001: 50-63.
|
|
|
| [17] |
PEREZ S I, BERNAL V, GONZALEZ P N Differences between sliding semi-landmark methods in geometric morphometrics, with an application to human craniofacial and dental variation[J]. Journal of Anatomy, 2006, 208 (6): 769- 784
doi: 10.1111/j.1469-7580.2006.00576.x
|
|
|
| [18] |
PLESSERS K, VANDEN B P, VAN D C, et al Virtual reconstruction of glenoid bone defects using a statistical shape model[J]. Journal of Shoulder and Elbow Surgery, 2018, 27 (1): 160- 166
doi: 10.1016/j.jse.2017.07.026
|
|
|
| [19] |
NOLTE D, BULL A M J Femur finite element model instantiation from partial anatomies using statistical shape and appearance models[J]. Medical Engineering and Physics, 2019, 67 (5): 55- 65
|
|
|
| [20] |
HENSELER H, KHAMBAY B, JU X, et al Landmark-based statistical procrustes analysis in the examination of breast shape and symmetry[J]. Handchirurgie, Mikrochirurgie, Plastische Chirurgie, 2014, 46 (6): 342- 349
|
|
|
| [21] |
LUTHI M, GERIG T, JUD C, et al Gaussian process morphable models[J]. IEEE Transactions on Pattern Analysis and Machine Intelligence, 2018, 40 (8): 1860- 1873
doi: 10.1109/TPAMI.2017.2739743
|
|
|
| [22] |
BEDKOWSKI J, PELKA M, MAJEK K, et al. Open source robotic 3D mapping framework with ROS —robot operating system, PCL—point cloud library and cloud compare [C]// 2015 International Conference on Electrical Engineering and Informatics. Denpasar: IEEE, 2015: 644-649.
|
|
|
| [23] |
YU W, TANNAST M, ZHENG G Non-rigid free-form 2D–3D registration using a B-spline-based statistical deformation model[J]. Pattern Recognition, 2017, 63: 689- 699
doi: 10.1016/j.patcog.2016.09.036
|
|
|
| [24] |
邹涛, 王继成, 黄源, 等 中文文档自动分类系统的设计与实现[J]. 中文信息学报, 1999, 13 (3): 26- 32
ZOU Tao, WANG Ji-cheng, HUANG Yuan, et al The design and implementation of an automatic Chinese documents classification system[J]. Journal of Chinese Information processing, 1999, 13 (3): 26- 32
|
|
|
| [25] |
GUHA S, RASTOGI R, SHIM K Rock: a robust clustering algorithm for categorical attributes[J]. Information Systems, 1999, 25 (5): 345- 366
|
|
|
| [26] |
HAQ R, CATES J, BESACHIO D A, et al. Statistical shape model construction of lumbar vertebrae and intervertebral discs in segmentation for discectomy surgery simulation [M]// VRTOVEC T, YAO J, GLOCKER B, et al. Computational methods and clinical applications for spine imaging. [S.l.]: Springer, 2015: 85-96.
|
|
|
| [27] |
MUTSVANGWA T, BURDIN V, SCHWARTZ C, et al An automated statistical shape model developmental pipeline: application to the human scapula and humerus[J]. IEEE Transactions on Biomedical Engineering, 2014, 62 (4): 1098- 1107
|
|
|
|
Viewed |
|
|
|
Full text
|
|
|
|
|
Abstract
|
|
|
|
|
Cited |
|
|
|
|
| |
Shared |
|
|
|
|
| |
Discussed |
|
|
|
|