1. School of Earth Sciences, Zhejiang University, Hangzhou 310058, China 2. Ocean Academy, Zhejiang University, Zhoushan 316000, China 3. Key Laboratory of Zhejiang Ocean Observation-Imaging Testbed of Zhejiang Province, Zhoushan 316000, China 4. China Aero Geophysical Survey and Remote Sensing Center for Natural Resources, Beijing 100083, China
The sea area around Daijin Island of Huangmao Sea in the Pearl Estuary, China is the habitat of Chinese white dolphins. Compact airborne spectrographic imager (CASI) image was employed to observe the suspended sediment concentration (SSC), and a single band inversion model for the CASI and moderate-resolution imaging spectroradiometer (MODIS) was established based on the in-situ spectral measurement, in order to assess the sea water quality in this area. The accuracy of inversion SSC was assessed by MODIS with in-situ SSC data. Results show that single-band exponential model based on CASI data performs well in inversing the suspended sediment concentration in the experimental sea area with the relative error of 11.16%, and of 15.18% for MODIS. The suspended sediment concentration in the study area ranges from 0.48 to 12.15 mg/L, and the direct ecological impact to the dolphin reserve should be neglected. Combined with the observation from MODIS image of suspended sediment in the Pearl Estuary, the land-based input from the west coast of Huangmao Sea is identified as the main material source, meanwhile, there is obvious branching phenomena when the terrestrial sediments are transported from the Huangmao Sea to the outside of the estuary. The main axis of runoff is transported from northwest to southeast in the estuary, while the coastal current is transported from northeast to southwest along Dajin Island. As a result, area with low suspended sediment and high transparency forms in the north of Dajin Island, which is suitable for the thriving of dolphin.
Guo-rong HUANG,Xiao-yu ZHANG,Ya-chao HAN,Jia-xing CHEN,Yong-jun ZHANG. Observation of suspended sediment in sea area around Dajin Island based on multi-source remote sensing data. Journal of ZheJiang University (Engineering Science), 2020, 54(5): 985-995.
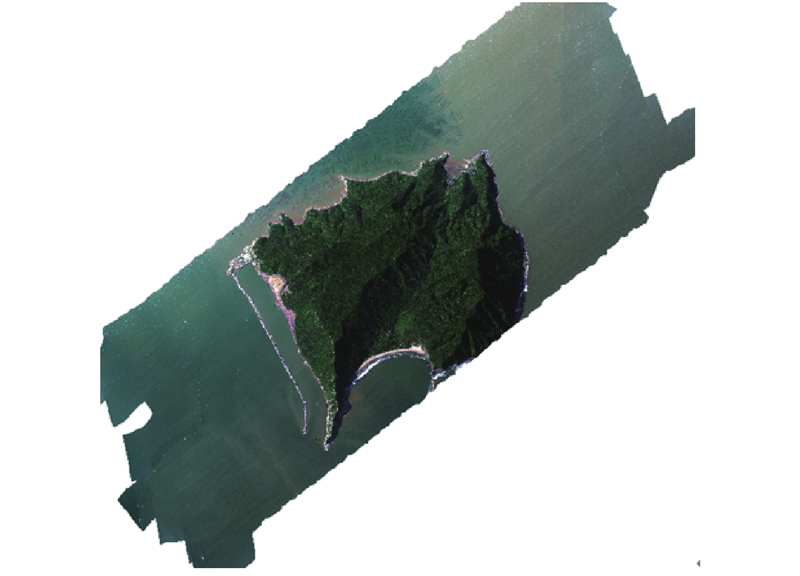
Fig.1True color synthesis of CASI data in study area
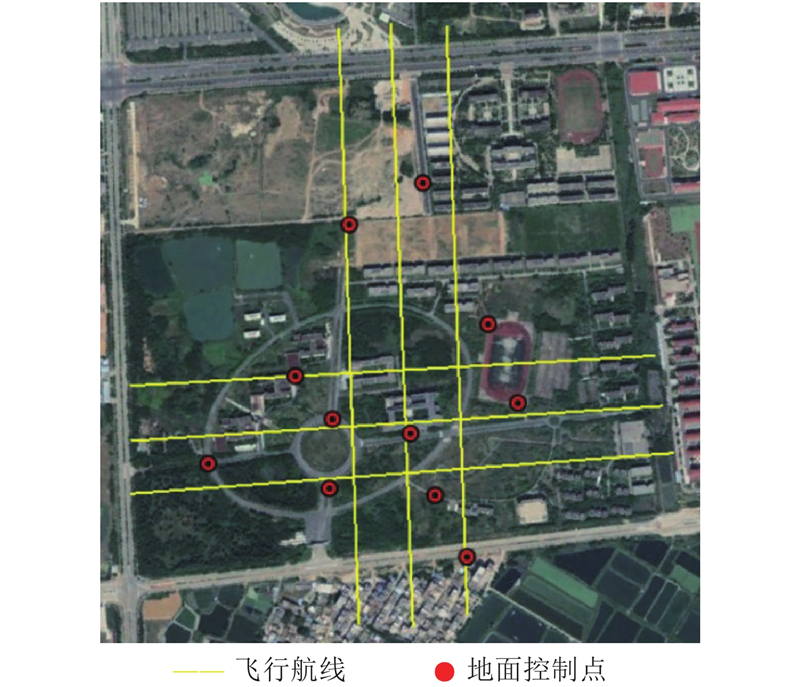
Fig.2Distribution of ground control points and checkpoint route of CASI
Fig.3Noise of water body in study area
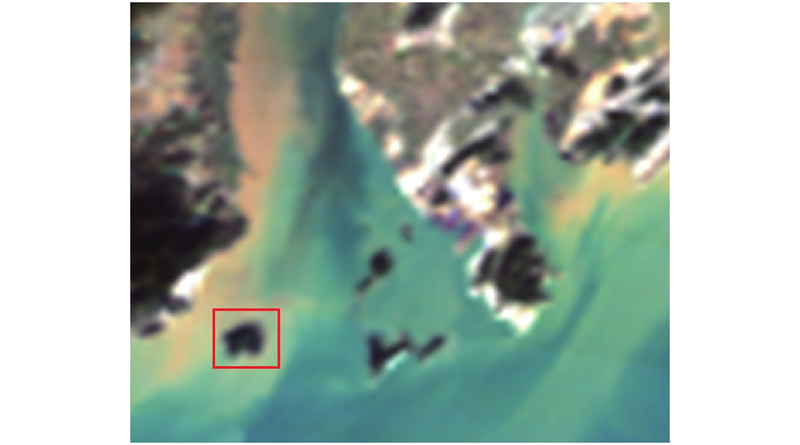
Fig.4Fast view of MODIS image used in study with Dajin Island and surrounding waters marked by box
Fig.5In situ water sampling and spectral measurement locations in sea area around Dajin Island
站位
经度
纬度
ρB/(mg?L?1)
T1
113°4′26.34″
21°57′29.58″
10.07
T2
113°3′15.30″
21°54′19.38″
7.54
T3
113°2′24.24″
21°53′54.90″
8.74
T4
113°2′0.36″
21°53′40.5″
8.34
T5
113°4′18.84″
21°57′33.78″
9.54
T6
113°4′50.88″
21°56′49.68″
6.14
T7
113°5′13.20″
21°56′15.84″
1.77
T8
113°4′29.04″
21°55′41.64″
6.94
T9
113°5′41.04″
21°55′14.4″
1.87
T10
113°5′49.86″
21°54′43.14″
7.87
T11
113°2′33″
21°54′58.02″
10.94
T12
113°2′43.68″
21°54′27.78″
10.94
T13
113°2′50.1″
21°54′12.42″
11.14
T14
113°2′58.38″
21°53′59.92″
3.26
T15
113°3′8.7″
21°53′44.52″
11.74
T16
113°3′13.5″
21°53′28.02″
10.34
T17
113°3′21.12″
21°53′3.78″
18.74
T18
113°4′26.34″
21°57′29.58″
4.34
T19
113°3′15.30″
21°54′19.38″
2.14
T20
113°1′39.48″
21°51′10.14″
11.34
T21
113°1′34.62″
21°51′5.52″
3.54
T22
113°1′20.04″
21°51′1.62″
13.14
T23
113°1′13.62″
21°50′57.36″
3.54
T24
113°2′30.48″
21°54′4.92″
2.74
T25
113°2′14.82″
21°53′51.48″
7.34
T26
113°0′37.74″
21°50′55.98″
6.54
T27
113°0′1.26″
21°51′4.14″
3.74
T28
113°0′16.32″
21°51′2.7″
10.34
T29
112°59′56.4″
21°51′5.16″
8.74
T30
112°59′52.32″
21°51′18.9″
2.74
T31
112°59′56.28″
21°51′33.9″
2.34
T32
112°59′55.62″
21°51′44.04″
10.54
T33
112°59′57.12″
21°51′53.46″
8.14
T34
112°59′58.2″
21°51′54.78″
9.74
T35
113°0′0.6″
21°52′2.34″
8.74
T36
113°0′0.72″
21°52′10.38″
7.54
T37
113°0′4.62″
21°52′19.8″
9.94
Tab.2Longitude and latitude of stations and measured suspended sediment mass concentration
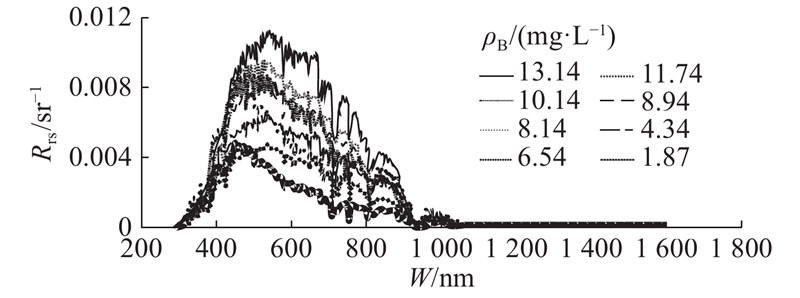
Fig.6Spectral curves measured in water body around Dajin Island before and after denoising(taking T22 station as an example)
Fig.7Denoised spectral curves measured in water body around Dajin Island
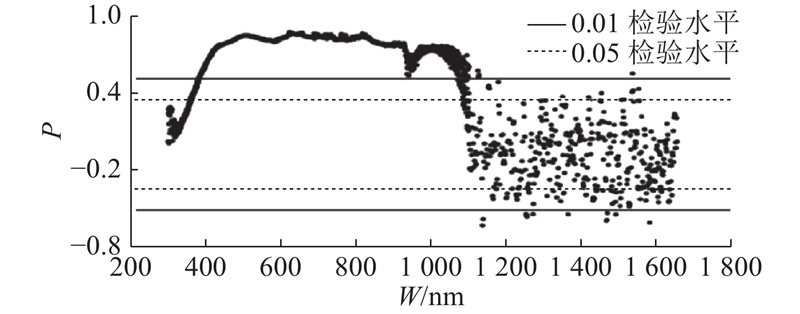
Fig.8Correlation coefficient between measured suspended sediment mass concentration and remote sensing reflectance
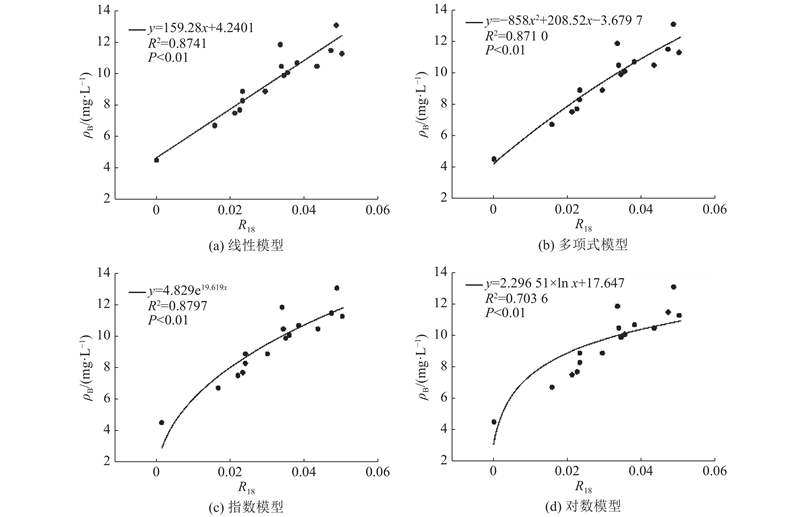
Fig.9Comparison of different SSC inversion models based on single band reflectance of CASI
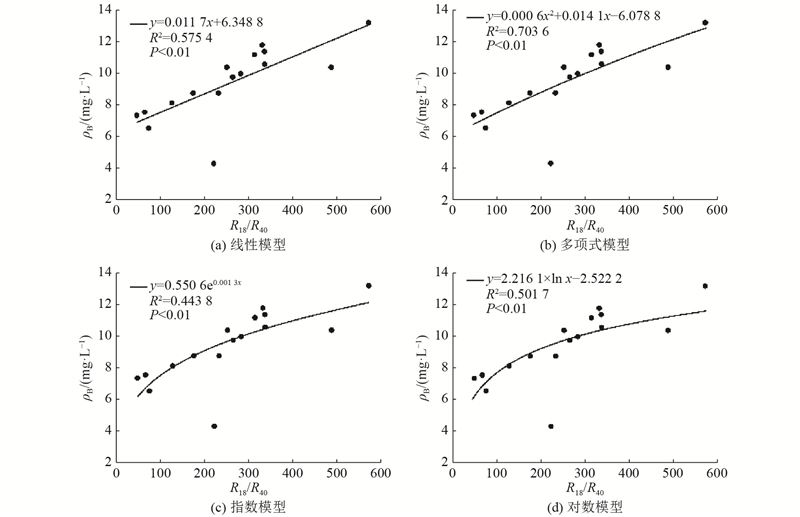
Fig.10Comparison of different SSC inversion models based on CASI bands ratio
站位号
ρB/(mg·L?1)
e/%
实测
反演
*P<0.01
T14
3.26
2.51
23.02
T17
18.74
16.41
12.43
T21
3.54
2.90
18.15
T23
3.54
3.30
6.68
T24
2.74
2.73
0.31
T27
3.74
3.29
11.90
T30
2.74
2.57
6.03
T31
2.34
2.09
10.73
Tab.3Error analysis of SSC obtained by single band inversion model
站位号
ρB/(mg·L?1)
e/%
实测
反演
*P<0.01
T14
3.26
2.94
9.67
T17
18.74
14.36
23.35
T21
3.54
2.50
29.30
T23
3.54
2.98
15.81
T24
2.74
2.40
12.27
T27
3.74
3.43
8.17
T30
2.74
2.62
4.55
T31
2.34
1.59
32.05
Tab.4Error analysis of SSC obtained by bands ratio inversion model
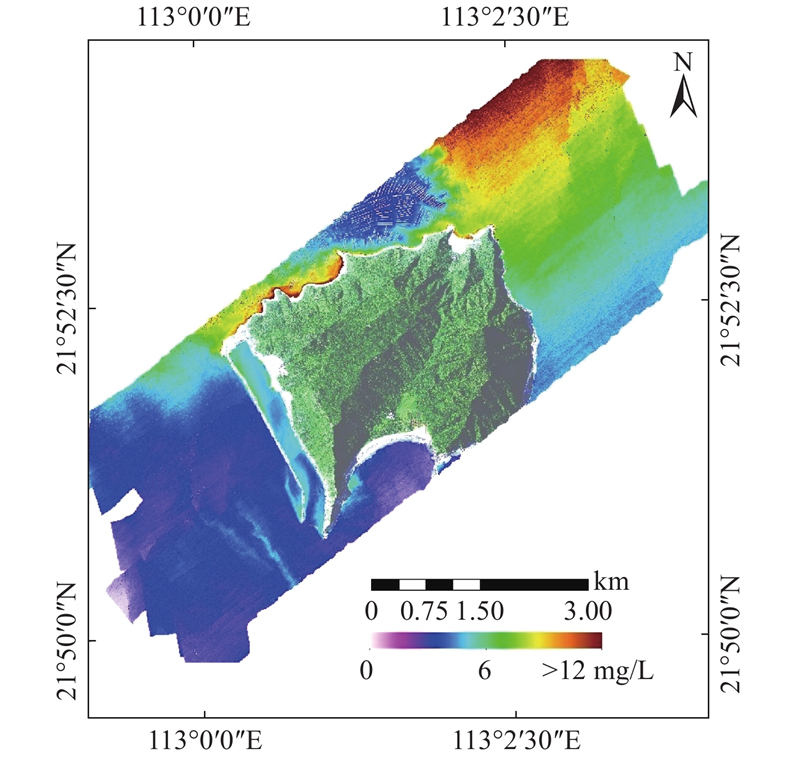
Fig.11Inversion of SSC from CASI data in Dajin Island
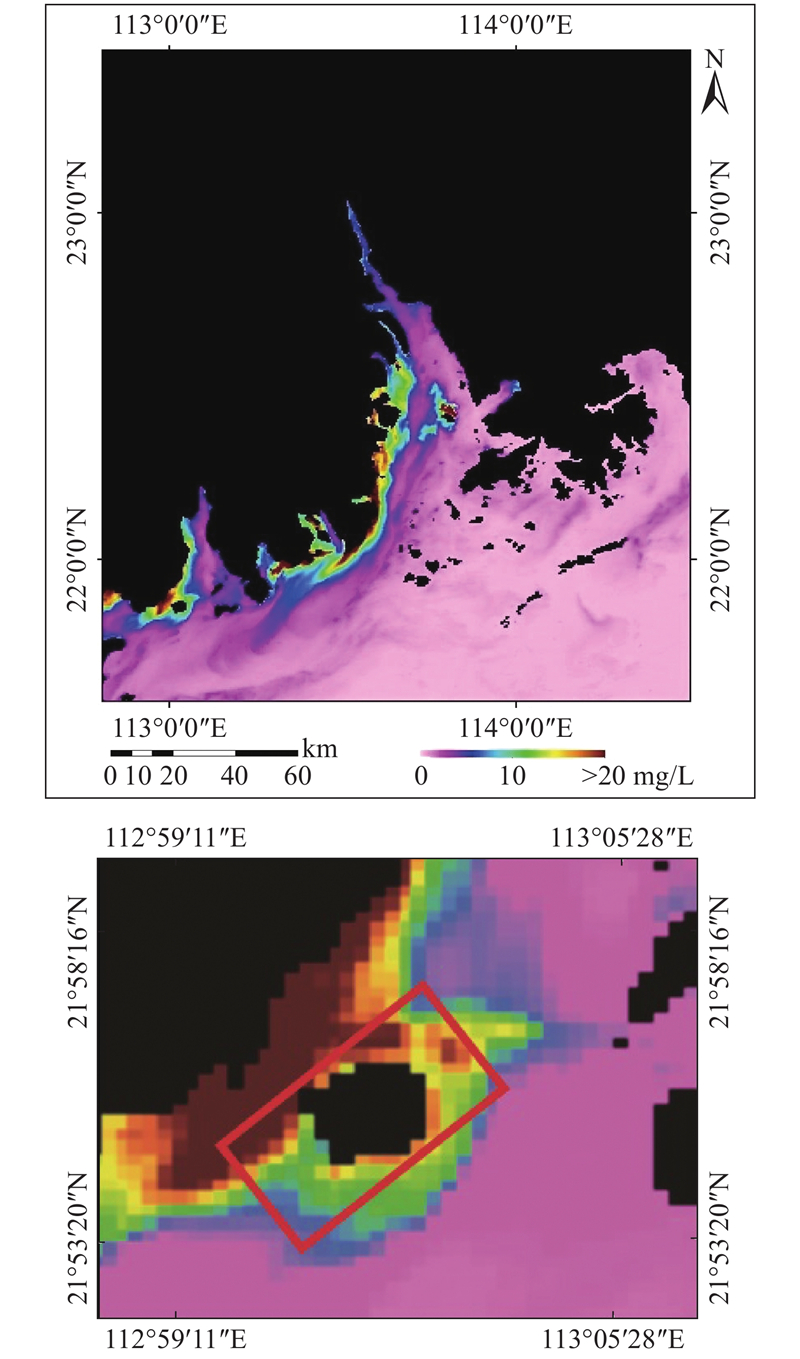
Fig.12Inversion of SSC from MODIS data in Pearl River Estuary with range of CASI image marked by box
站位号
ρB/(mg·L?1)
e/%
实测
反演
T1
10.07
8.81
12.48
T2
7.54
6.43
14.68
T3
8.74
7.84
10.31
T4
8.34
7.07
15.27
T5
9.54
8.80
7.76
T6
6.14
5.04
17.98
T7
1.77
1.43
19.48
T8
6.94
5.91
14.86
T9
1.87
1.56
16.61
T10
7.87
7.19
8.67
T11
10.94
9.58
12.45
T12
10.94
9.81
10.31
T14
3.26
2.34
28.12
T17
18.74
15.86
15.36
T19
2.14
1.79
16.23
T21
3.54
2.75
22.32
T23
3.54
3.10
12.35
T24
2.74
2.10
23.32
T27
3.74
3.17
15.32
T30
2.74
2.40
12.32
T31
2.34
2.05
12.54
Tab.5Error analysis of SSC obtained by MODIS inversion model
[1]
疏小舟, 尹球, 匡定波 内陆水体藻类叶绿素浓度与反射光谱特征的关系[J]. 遥感学报, 2000, 4 (1): 41- 45 SHU Xiao-zhou, YIN Qiu, KUANG Ding-bo Relationship between algal chlorophyll concentration and spectral reflectance of inland water[J]. Journal of Remote Sensing, 2000, 4 (1): 41- 45
doi: 10.11834/jrs.20000108
[2]
张兵, 申茜, 李俊生, 等 太湖水体3种典型水质参数的高光谱遥感反演[J]. 湖泊科学, 2009, 21 (2): 182- 192 ZHANG Bing, SHEN Qian, LI Jun-sheng, et al Retrieval of three kinds of representative water quality parameters of Lake Taihu from hyperspectral remote sensing data[J]. Journal of Lake Science, 2009, 21 (2): 182- 192
doi: 10.3321/j.issn:1003-5427.2009.02.005
[3]
杨光源. 基于HSI高光谱遥感数据的水体分布提取及泥沙质量浓度反演研究[D]. 南宁: 广西师范学院, 2011. YANG Guang-yuan. Research on extraction of water body and sediment concentration distribution inversion based on HIS hyperspectral remote sensing data [D]. Nanning: Guangxi Normal Education University, 2011.
[4]
SINDY S, ELS K, MARK B, et al Retrieval of suspended sediment from advanced hyperspectral sensor data in the Scheldt Estuary at different stages in the tidal cycle[J]. Marine Geodesy, 2007, 30 (1/2): 97- 108
[5]
OLMANSON L G, BREZONIK P L, BAUER M E Airborne hyperspectral remote sensing to assess spatial distribution of water quality characteristics in large rivers: the Mississippi River and its tributaries in Minnesota[J]. Remote Sensing of Environment, 2013, 130 (4): 254- 265
[6]
BIANCHI R, CAVALLI R M, MARINO C M, et al Use of airborne hyperspectral images to assess the spatial distribution of oil spilled during the Trecate blow-out (Northern Italy)[J]. Proceedings of SPIE: the International Society for Optical Engineering, 1995, (2585): 352- 362
[7]
卜志国. 航空高光谱遥感赤潮与油污染水体信息提取[D]. 青岛: 中国海洋大学, 2004. BU Zhi-guo. Air hyperspectral remote sensing of red tide and oil polluted water information extraction [D]. Qingdao: Ocean University of China, 2004.
[8]
娄全胜, 陈蕾, 王平, 等 高光谱遥感技术在海洋研究的应用及展望[J]. 海洋湖沼通报, 2008, (3): 168- 173 LOU Quan-sheng, CHEN Lei, WANG Ping, et al The application and prospecting of the hyperspectral remote sensing technology in marine research[J]. Transactions of Oceanology and Limnology, 2008, (3): 168- 173
doi: 10.3969/j.issn.1003-6482.2008.03.024
[9]
李文凯. 河口海域悬浮泥沙时空动态遥感研究: 以珠江口为例[D]. 武汉: 华中师范大学, 2017. LI Wen-kai. Remote sensing of suspended sediments concentration spatial-tempory dynamics in estuary water: a case in the Pearl River Estuary [D]. Wuhan: Central China Normal University, 2017.
[10]
李瑞杰, 王昌杰, 邵宇阳, 等 珠江口崖门出海航道回淤分析[J]. 中国港湾建设, 2005, (2): 9- 11 LI Rui-jie, WANG Chang-jie, SHAO Yu-yang, et al Research on sediment deposition in Yamen waterway[J]. China Harbor Engineering, 2005, (2): 9- 11
[11]
赵焕庭. 珠江河口演变[M]. 北京: 海洋出版社, 1990.
[12]
马玉, 陈浩昌, 蔡钰灿, 等 珠江口大襟岛中华白海豚保护区水质评价及影响因素分析[J]. 环境化学, 2011, 30 (9): 1674- 1675 MA Yu, CHEN Hao-chang, CAI Yu-can, et al Water quality assessment and influencing factors analysis of Chinese White Dolphin reserve in DaJin Island, Pearl River Estuary[J]. Environmental Chemistry, 2011, 30 (9): 1674- 1675
[13]
童李霞, 燕琴, 骆成凤, 等 基于NDWI分割与面向对象的水体信息提取[J]. 地理空间信息, 2017, 15 (5): 57- 59 TONG Li-xia, YAN Qin, LUO Cheng-feng, et al Water body information extraction based on NDWI segmentation and object-oriented method[J]. Geospatial Information, 2017, 15 (5): 57- 59
[14]
张东辉, 赵英俊, 陆冬华, 等 高光谱传感器CASI与SASI支持下的水体精准提取[J]. 传感器与微系统, 2016, 35 (5): 25- 27 ZHANG Dong-hui, ZHAO Ying-jun, LU Dong-hua, et al Accurate water extraction technology under support of CASI and SASI hyperspectral sensors[J]. Transducer and Microsystem Technologies, 2016, 35 (5): 25- 27
[15]
栾虹. 基于landsat8珠江口悬浮泥沙及叶绿素a浓度遥感反演及时空变化[D]. 湛江: 广东海洋大学, 2016. LUAN Hong. Based on Landsat8 the suspended sediment concentration and chlorophyll a concentration of the Pearl River Estuary remote sensing inversion and time and spatial change [D]. Zhanjiang: Guangdong Ocean University, 2016.
[16]
ZHAN W K, WU J, WEI X, et al Spatio-temporal variation of the suspended sediment concentration in the Pearl River Estuary observed by MODIS during 2003?2015[J]. Continental Shelf Research, 2019, 172: 22- 32
doi: 10.1016/j.csr.2018.11.007
[17]
朱樊, 欧素英, 张铄涵, 等 基于MODIS影像的珠江口表层悬沙浓度反演及时空变化分析[J]. 泥沙研究, 2015, (2): 67- 73 ZHU Fan, OU Su-ying, ZHANG Shuo-han, et al MODIS images-based retrieval and analysis of spatial-temporal change of superficial suspended sediment concentration in the Pearl River Estuary[J]. Journal of Sediment Research, 2015, (2): 67- 73
唐军武, 田国良, 汪小勇, 等 水体光谱测量与分析Ⅰ: 水面以上测量法[J]. 遥感学报, 2004, 8 (1): 37- 44 TANG Jun-wu, TIAN Guo-liang, WANG Xiao-yong, et al The methods of water spectra measurement and analysisⅠ: above-water method[J]. Journal of Remote Sensing, 2004, 8 (1): 37- 44
doi: 10.11834/jrs.20040106
[20]
贺芳. 小波去噪方法在光谱数据处理中的应用[D]. 天津: 天津理工大学, 2011. HE Fang. The application of wavelet denosing method in spectrum data processing [D]. Tianjin: Tianjin University of Technology, 2011.
[21]
王秉仁, 杨艳霞, 蔡伟, 等. 小波阈值降噪技术在振动信号处理中的应用[J]. 噪声与振动控制, 2008, 12(6): 9-13. WANG Bing-ren, YANG Yan-xia, CAI Wei, et al. Application of wavelet threshold de-noising technique in vibration signals processing [J]. Noise and Vibration Control, 2008, 12(6): 9-13.