

质子交换膜燃料电池(proton exchange membrane fuel cell,PEMFC)能够将化学能直接转化为电能,具有转换效率高、噪声低、无污染等优点[1]. 气体扩散层(gas diffusion layer,GDL)是PEMFC的重要组成部分,位于双极板和催化层(catalytic layer,CL)之间,多由碳材料构成. GDL的孔隙率分布对反应气体传输和PEMFC输出性能均具有显著影响[2-3]. 国内外学者为得到具有良好机械性能、优异导电性和合适孔隙率的GDL,进行了诸多有关结构设计和材料改性的研究. 刘舜等[4]发现,当GDL孔隙率从0.2增加到0.8时,PEMFC的电流密度逐渐增大,最大可达847 mA/cm2. Abraham等[5]基于田口方法对GDL孔隙率进行优化,仿真结果表明GDL优化后,PEMFC的功率密度提高了12.5%. Xia等[6]研究了GDL孔隙率大小和厚度对反应气体传输的影响,结果显示当阳极和阴极GDL的厚度分别为80~120 μm和140~170 μm时,氧气传输效果更佳;当GDL孔隙率为35%~45%时,电池性能更优. 程植源等[7]将GDL沿厚度方向进行分层处理,认为具有梯度结构的GDL可以有效防止“水淹”并能有效提升燃料电池的性能. Jha等[8]研究发现,当GDL孔隙率从0.6增加到0.7时,PEMFC的阴极氧气消耗减少了7%.
上述方法虽然对GDL的孔隙率大小及分布进行了优化,但孔隙率设计方案相对简单,不能充分展现孔隙率分布对燃料电池传质及输出性能的影响. 本研究分别建立平行流场、蛇形流场和叶脉流场的三维PEMFC模型,探究不同流场模型中常规扩散层孔隙率分布方案对氧气摩尔分数分布的影响规律;基于不同流场模型催化层中氧气摩尔分数的分布特征,提出对应3种流场模型分布的GDL孔隙率分布方案;分析不同PEMFC的膜电流密度分布、极化曲线与功率密度曲线.
1. 模型与验证
1.1. 几何模型
碳布和碳纸是常见的2种GDL材料. 碳布质地柔软、支撑性差;碳纸多由碳纤维压制而成,具有良好的导电性和支撑力. 合适的孔隙能为PEMFC内反应物的传输提供通路,如图1所示为不同孔隙率的GDL材料SEM图像,其中εp为碳纸孔隙率,εc为碳布孔隙率.
图 1

图 1 不同孔隙率的扩散层SEM图像
Fig.1 SEM images of gas diffusion layer for different porosity
图 2
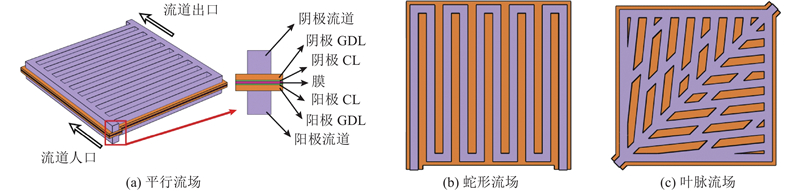
图 2 质子交换膜燃料电池流场的几何模型
Fig.2 Geometric models of flow field for proton exchange membrane fuel cell
表 1 质子交换膜燃料电池模型的几何参数和操作条件
Tab.1
| 参数 | 数值 | 参数 | 数值 | |
| 流道宽度/mm | 1.0 | 阴极入口速度/(m·s−1) | 5.180 7 | |
| 流道高度/mm | 1.0 | 阳极入口速度/(m·s−1) | 1.450 6 | |
| 肋板宽度/mm | 1.0 | 加湿温度/K | 301.15 | |
| GDL宽度/mm | 2.54 | GDL渗透率/m2 | 1.18×10⁻¹³ | |
| 膜厚度/mm | 0.1 | 多孔电极渗透率/m2 | 2.36×10⁻¹⁴ | |
| CL厚度/mm | 0.05 | 阴极传递系数 | 1.0 | |
| 电池温度/K | 333.15 | 入口水的摩尔分数 | 0.374 98 | |
| 参考压力/Pa | 101 330 | 入口氢的摩尔分数 | 0.625 02 | |
| 开路电压/V | 0.97 | 入口氧的摩尔分数 | 0.131 26 | |
| GDL电导率/(S·m−1) | 4 000 | 入口氮的摩尔分数 | 0.493 77 | |
| 阴极化学计量比 | 3 | 相对湿度/% | 100 | |
| 阳极化学计量比 | 2 | — | — |
1.2. 模型假设
对PEMFC模型进行如下假设:1)PEMFC处于稳定工作状态,2)反应气体均为理想气体,3)反应气体流动为层流,4)反应气体不可压缩,5)忽略重力影响.
1.3. 控制方程
在PEMFC的电化学反应过程中,质量、动量、能量、电荷、组分均守恒.
1)质量守恒方程:
式中:ε为多孔介质孔隙率,ρ为反应气体密度, t为时间,Sm为质量源项,u为反应气体速度矢量.
2)动量守恒方程:
式中:
3)能量守恒方程:
式中:cp为比定压热容,T为温度, keff为有效热导率,SQ为能量源项.
4)电荷守恒方程:
式中:σsol为固相电导率,σmem为电解质相电导率,
5)组分守恒方程:
式中:ci为组分i的浓度;
一般使用Butler-Volmer方程描述催化层发生的反应,表达式为
式中:ηa为阳极活化过电压,ηc为阴极活化过电压,F为法拉第常数,R为摩尔气体常数,
1.4. 网格独立性与模型验证
为了验证网格无关性,对平行流场PEMFC模型采用4种密集程度不同的网格划分方案,在相同操作条件下对模型极化曲线进行仿真,并基于模型 4的电流密度计算相对误差
图 3
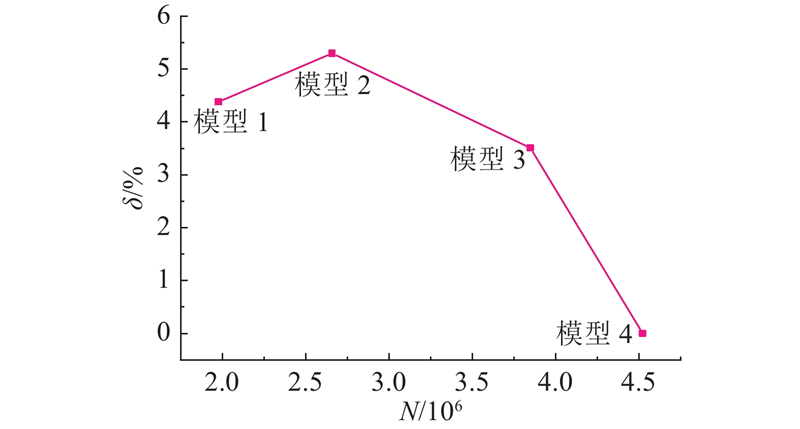
图 3 质子交换膜燃料电池模型的网格无关性验证
Fig.3 Mesh independence verification of proton exchange membrane fuel cell model
图 4
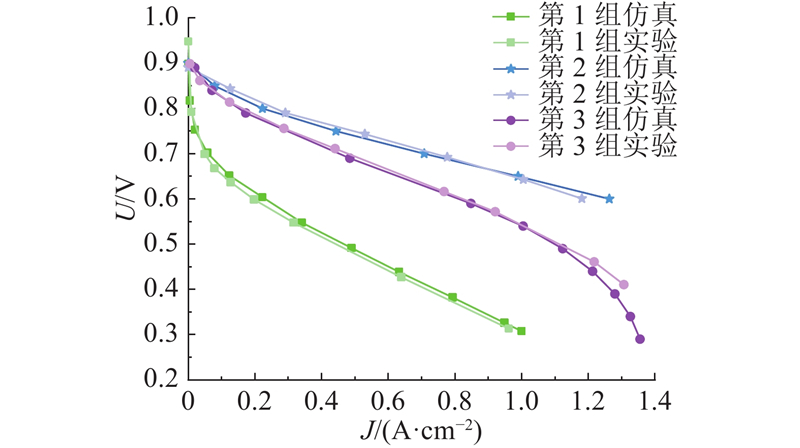
图 4 3组仿真极化曲线与实验数据对比
Fig.4 Comparison of three curves of simulation polarization with experimental data
2. 结果与分析
2.1. 平行流场对比
2.1.1. 孔隙率设计及氧气摩尔分数分布
为了分析扩散层孔隙率大小对平行流场PEMFC输出性能的影响,分别建立孔隙率为0.40、0.50和0.60的3种扩散层模型. 如图5所示为平行流场PEMFC在Uw=0.54 V、采用3种不同孔隙率(ε1=0.40、ε2=0.50、ε3=0.60)分布方案时,催化层中的氧气摩尔分数
图 5
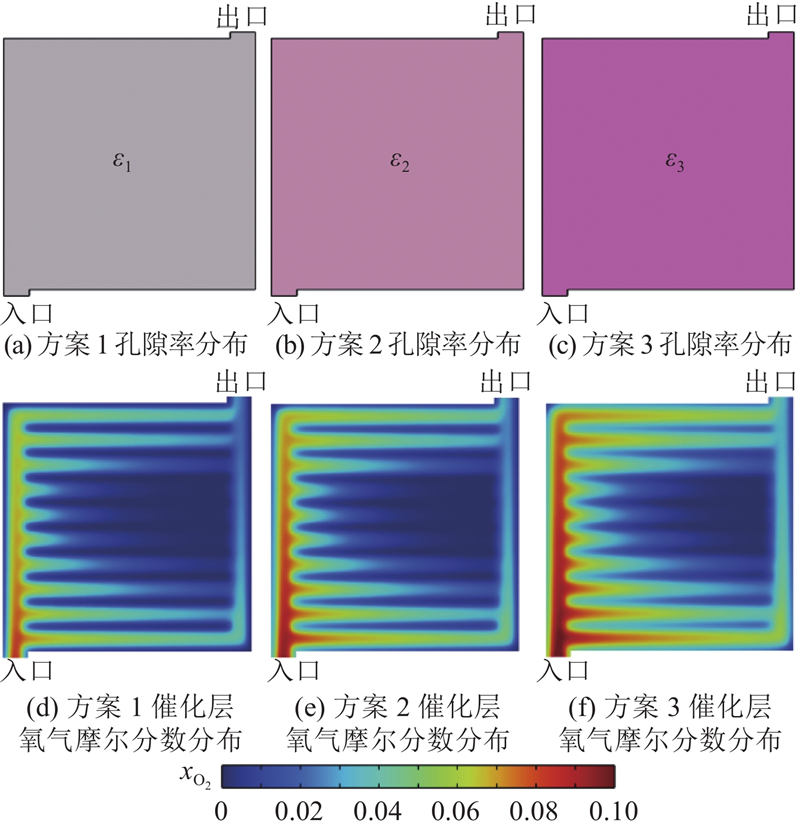
图 5 平行流场常规孔隙率分布方案以及3种方案对应的催化层氧气摩尔分数分布(Uw=0.54 V)
Fig.5 Conventional porosity distribution scheme of parallel flow field, oxygen mole fraction distribution of catalytic layer corresponding to three schemes (Uw=0.54 V)
孔隙率对扩散层中的气体传输起着至关重要作用. 孔隙率越大催化层界面上氧气摩尔分数越高,但当孔隙率过高时,GDL电导率将急剧下降,导致欧姆极化损失增大[12]. 为了研究GDL孔隙率对PEMFC传质特性及输出性能的影响,基于图5催化层中氧气摩尔分数分布特征提出3种GDL孔隙率梯度分布方案,如图6所示. 方案4~6的孔隙率分布比方案1~3的孔隙率分布更规则,氧气摩尔分数高则孔隙率相对较小,氧气摩尔分数低则孔隙率相对较大,有利于氧气从流道到扩散层的均匀传质. 如图7所示,方案1~6中催化层氧气平均摩尔分数分别为0.017 5、0.021 3、0.022 1、0.020 5、0.021 2和0.021 6,其中方案3的氧气平均摩尔分数最大. 大孔隙率的GDL虽然提高了氧气向CL的扩散效率,但对比图1(b)和图1(c)可知,碳纤维体积减小会导致GDL导电性下降,不利于PEMFC电流密度的提高[13].
图 6

图 6 平行流场梯度孔隙率分布方案以及3种方案对应的催化层氧气摩尔分数分布(Uw=0.54 V)
Fig.6 Gradient porosity distribution scheme of parallel flow, oxygen mole fraction distribution of catalytic layer corresponding to three schemes (Uw=0.54 V)
图 7
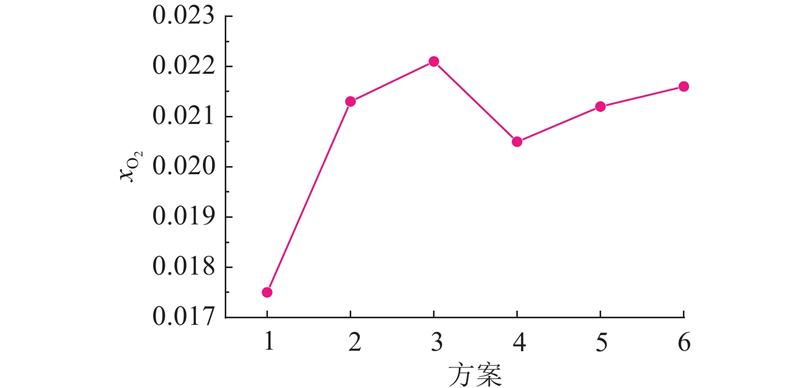
图 7 平行流场中不同孔隙率分布方案的氧气平均摩尔分数
Fig.7 Average oxygen molar fraction of different porosity distribution schemes in parallel flow fields
2.1.2. 膜电流密度分布
图 8
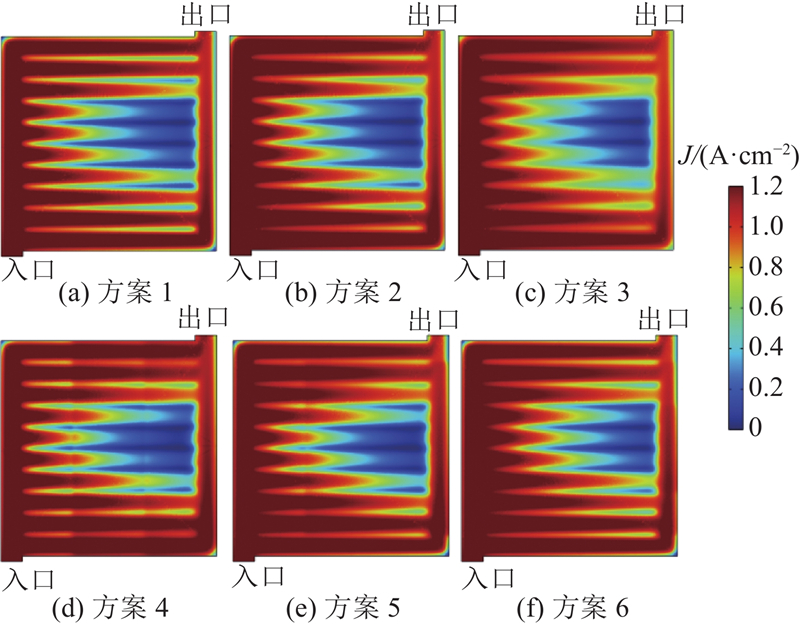
图 8 平行流场不同孔隙率分布方案的膜电流密度分布(Uw=0.54 V)
Fig.8 Distribution of membrane current density for different porosity distribution schemes in parallel flow fields (Uw=0.54 V)
图 9
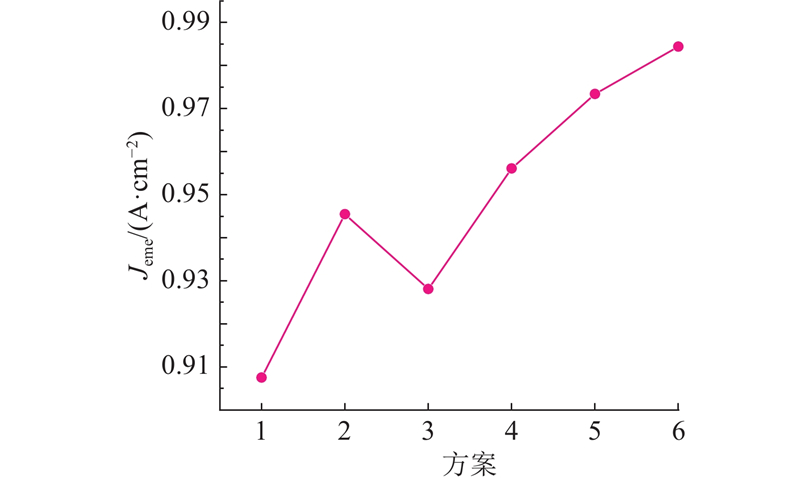
图 9 平行流场不同孔隙率分布方案的平均膜电流密度
Fig.9 Average membrane current density of different porosity distribution schemes in parallel flow fields
2.1.3. 极化曲线与功率密度曲线
如图10所示为采用6种不同孔隙率分布方案时,平行流场PEMFC的极化曲线与功率密度曲线,峰值功率密度P分别为0.491 2、0.512 3、0.503 2、0.517 9、0.527 4和0.533 4 W/cm2,当PEMFC终止电压U=0.39 V时电流密度分别为1.058、1.119、1.101、1.139、1.148和1.161 A/cm2. 方案6的峰值功率密度较前5种方案分别提高了8.59%、4.12%、6.00%、2.99%和1.14%,电流密度较前5种方案分别提高了9.74%、3.75%、5.45%、1.93%和1.13%.
图 10
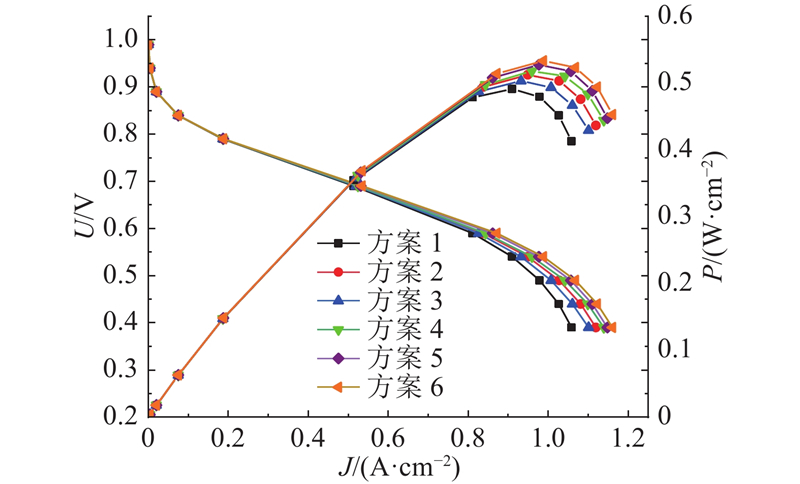
图 10 平行流场不同孔隙率分布方案极化曲线与功率密度曲线
Fig.10 Polarization curves and power density curves of different porosity distribution schemes in parallel flow fields
2.2. 蛇形流场对比
2.2.1. 孔隙率设计及氧气摩尔分数分布
为了分析扩散层孔隙率大小对蛇形流场PEMFC输出性能的影响,分别建立孔隙率为0.40、0.50和0.60的3种扩散层模型. 如图11所示为催化层中氧气摩尔分数分布特征,相应的孔隙率(ε1=0.40、ε2=0.50、ε3=0.60、ε4=0.70、ε5=0.30、ε6=0.45)分布方案如图12所示. 由图11、12可以看出,蛇形流场催化层入口处氧气摩尔分数较出口处更高,沿气体流动方向氧气摩尔分数梯度下降. 方案7~14中的氧气平均摩尔分数分别为0.017 5、0.021 6、0.022 8、0.025 6、0.019 6、0.031 0、0.023 4和0.024 0,方案6催化层的平均氧气摩尔分数分布最佳.
图 11
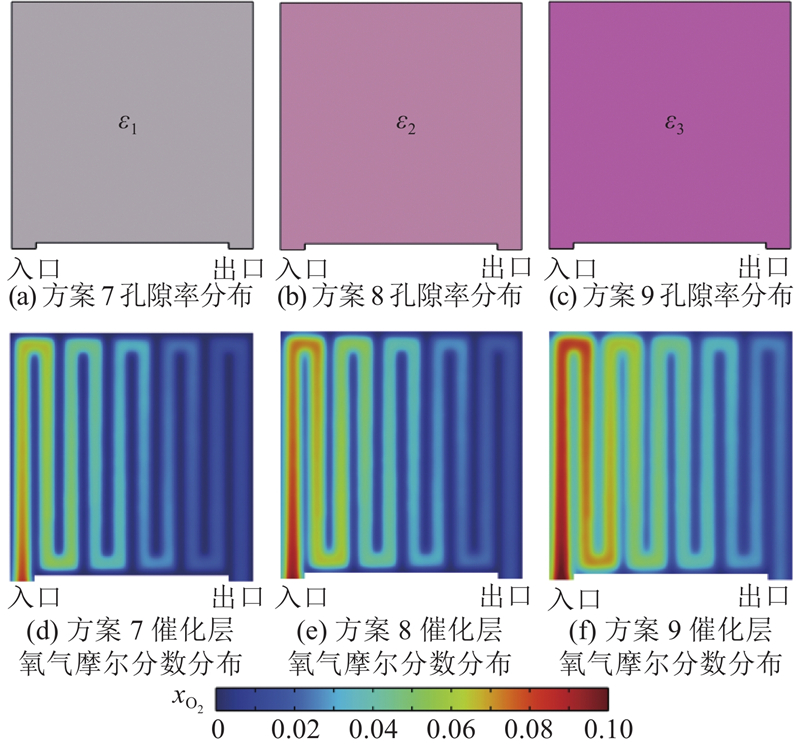
图 11 蛇形流场常规孔隙率分布方案以及3种方案对应的催化层氧气摩尔分数分布(Uw=0.54 V)
Fig.11 Conventional porosity distribution scheme of serpentine flow field, oxygen mole fraction distribution of catalytic layer corresponding to three schemes (Uw=0.54 V)
图 12
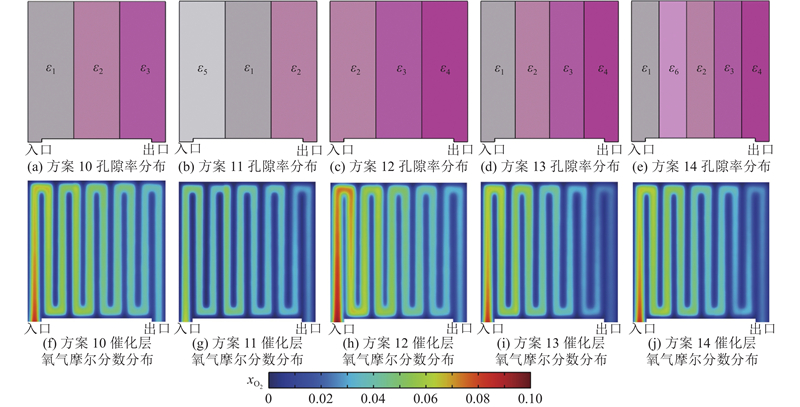
图 12 蛇形流场梯度孔隙率分布方案以及5种方案对应的催化层氧气摩尔分数分布(Uw=0.54 V)
Fig.12 Gradient porosity distribution scheme of serpentine flow, oxygen mole fraction distribution of catalytic layer corresponding to five schemes (Uw=0.54 V)
2.2.2. 膜电流密度分布
图 13
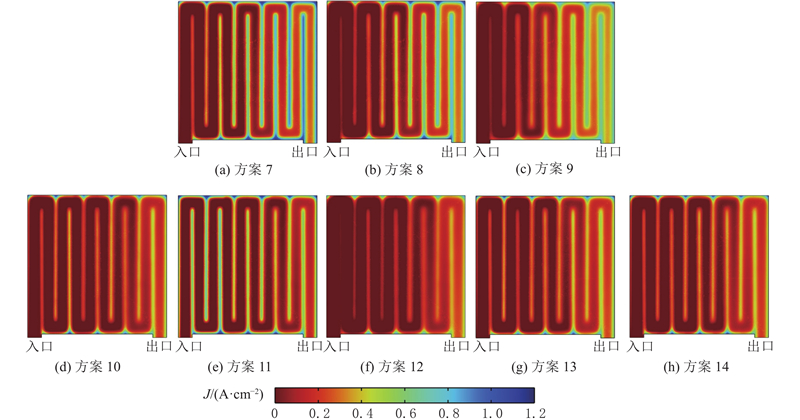
图 13 蛇形流场不同孔隙率分布方案的膜电流密度分布(Uw=0.54 V)
Fig.13 Distribution of membrane current density for different porosity distribution schemes in serpentine flow fields (Uw=0.54 V)
图 14
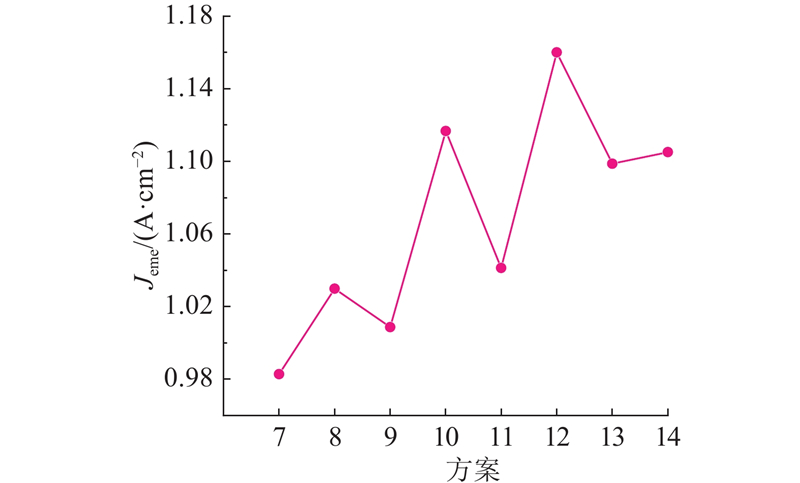
图 14 蛇形流场不同孔隙率分布方案的平均膜电流密度
Fig.14 Average membrane current density of different porosity distribution schemes in serpentine flow fields
2.2.3. 极化曲线与功率密度曲线
如图15所示为采用8种孔隙率分布方案时蛇形流场PEMFC的极化曲线与功率密度曲线,峰值功率密度分别为0.531 9、0.558 1、0.547 0、0.605 4、0.563 8、0.629 0、0.595 6和0.599 1 W/cm2,终止电压为0.39 V时电流密度分别为1.122、1.192、1.185、1.270、1.238、1.270、1.270和1.270 A/cm2. 方案12的峰值功率密度较其他7种分别提高了18.26%、12.70%、14.90%、3.90%、11.56%、3.90%、5.61%和4.99%. 对于蛇形流场PEMFC,增大GDL孔隙率可以提高催化层中氧气平均摩尔分数,但是当孔隙率过高时,由于GDL电导率急剧下降,反而使膜电流密度降低(方案7~9). 沿水平方向增加GDL孔隙率层数可在一定程度上提高催化层中氧气平均摩尔分数和膜电流密度,但随着层数的增加效果变得不明显(方案8、10、13和14). 方案12增大了蛇形流场出口附近的孔隙率,明显改善了氧气供应,而入口处采用较优孔隙率,因此方案12中的峰值功率密度和电流密度均最优.
图 15
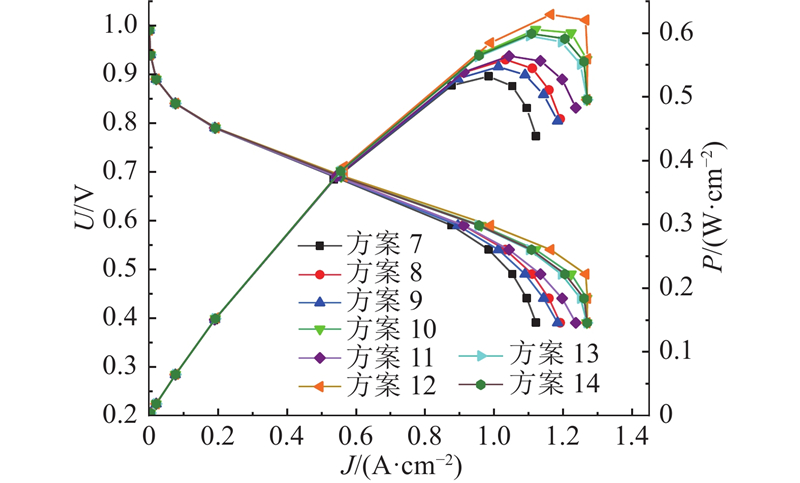
图 15 蛇形流场不同孔隙率分布方案极化曲线与功率密度曲线
Fig.15 Polarization curves and power density curves of different porosity distribution schemes in serpentine flow fields
2.3. 叶脉流场对比
2.3.1. 孔隙率设计及氧气摩尔分数分布
为了分析扩散层孔隙率大小对叶脉流场PEMFC输出性能的影响,分别建立孔隙率为0.40、0.50和0.60的3种扩散层模型. 如图16所示为催化层中氧气摩尔分数分布特征,相应的孔隙率梯度分布方案如图17所示. 由图16可以看出,与主流道对应的催化层中氧气摩尔分数较高且沿着气体流动方向逐渐降低,整个催化层中的氧气摩尔分数沿主流道对称分布,氧气摩尔分数最低位置出现在气体出口附近的几条支流道中. 由图16、17可知,6种分布方案的CL氧气摩尔分数分布均因参与化学反应消耗而使其摩尔分数不断减小,但方案20相较于前5种分布方案氧气摩尔分数分布更加均匀且平均值相对较大,原因是方案20的孔隙率分布更加规则,有利于氧气从流道到催化层的单方向均匀传质,也说明孔隙率梯度分布的阴极扩散层气体传质优于单一分布的阴极扩散层气体传质. 如图18所示,6种方案的催化层氧气平均摩尔分数分别为0.023 5、0.029 1、0.028 2、0.028 3、0.028 0和0.043 7,其中方案20催化层中氧气平均摩尔分数最高.
图 16

图 16 叶脉流场常规孔隙率分布方案以及3种方案对应的催化层氧气摩尔分数分布(Uw=0.54 V)
Fig.16 Conventional porosity distribution scheme of leaf vein flow field, oxygen mole fraction distribution of catalytic layer corresponding to three schemes (Uw=0.54 V)
图 17
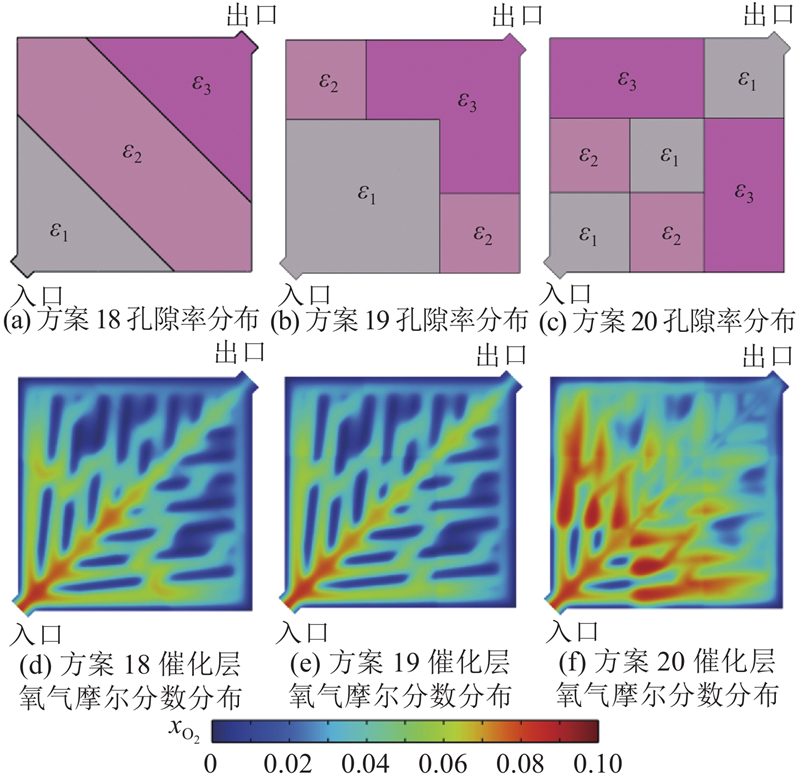
图 17 叶脉流场梯度孔隙率分布方案以及3种方案对应的催化层氧气摩尔分数分布(Uw=0.54 V)
Fig.17 Gradient porosity distribution scheme of leaf vein flow field, oxygen mole fraction distribution of catalytic layer corresponding to three schemes (Uw=0.54 V)
图 18
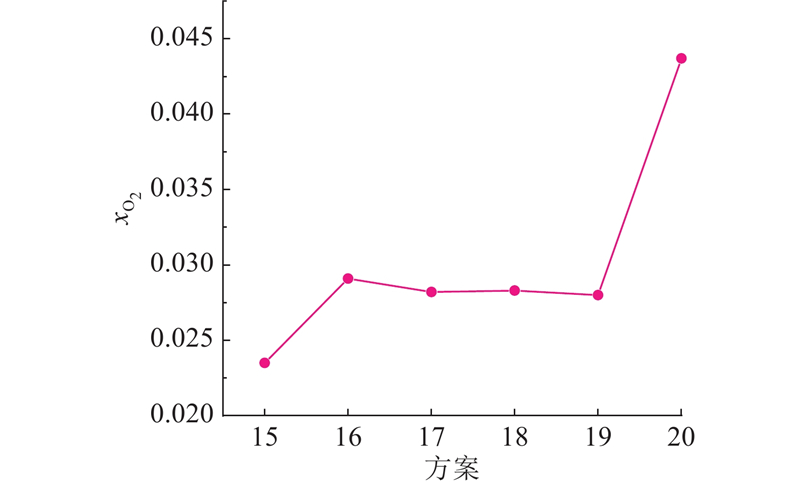
图 18 叶脉流场不同孔隙率分布方案的氧气平均摩尔分数
Fig.18 Average oxygen mole fraction of different porosity distribution schemes in leaf vein flow fields
2.3.2. 膜电流密度分布
图 19

图 19 叶脉流场不同孔隙率分布方案的膜电流密度分布(Uw=0.54 V)
Fig.19 Distribution of membrane current density for different porosity distribution schemes in leaf vein flow fields (Uw=0.54 V)
图 20
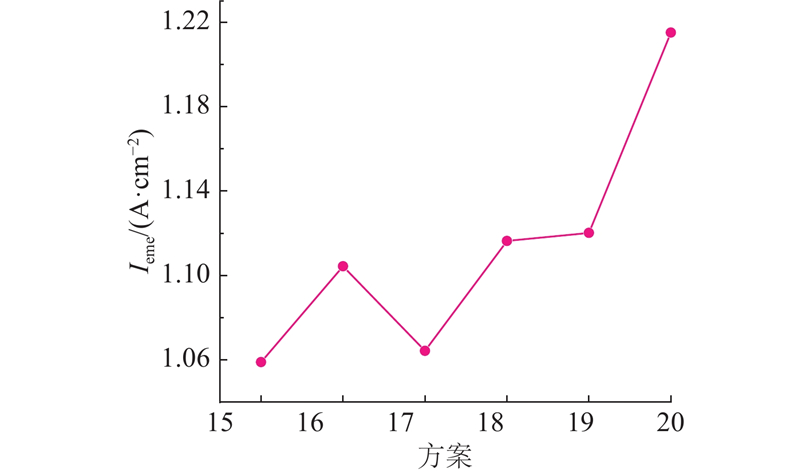
图 20 叶脉流场不同孔隙率分布方案的平均膜电流密度
Fig.20 Average membrane current density of different porosity distribution schemes in leaf vein flow fields
2.3.3. 极化曲线与功率密度曲线
如图21所示为采用6种不同孔隙率分布方案时叶脉流场PEMFC的极化曲线与功率密度曲线,峰值功率密度分别为0.572 6、0.597 8、0.576 2、0.604 2、0.606 9和0.661 1 W/cm2,当终止电压为0.39 V时,电流密度分别为1.259、1.342、1.285、1.328、1.356和1.367 A/cm2. 由图可知,当孔隙率采用方案20时,PEMFC输出性能最佳,峰值功率密度较前5种方案分别提高了15.46%、10.59%、14.73%、9.42%和8.93%,电流密度较前5种方案分别提高了8.58%、1.86%、6.39%、2.94%、0.81%. 对于叶脉流场PEMFC,增大GDL孔隙率不能改善催化层中氧气平均摩尔分数以及平均膜电流密度(方案15~17). 基于叶脉流场PEMFC催化层中氧气摩尔分数分布特征提出的GDL孔隙率梯度分布方案可以明显提高膜电流密度,改善电池输出性能(方案18~20). 方案20通过增大气体出口附近对应的GDL孔隙率改善了局部氧气供应,而主流道相对应的GDL孔隙率较低使扩散层电导率相对较高,因此方案20的峰值功率密度和电流密度均最优.
图 21
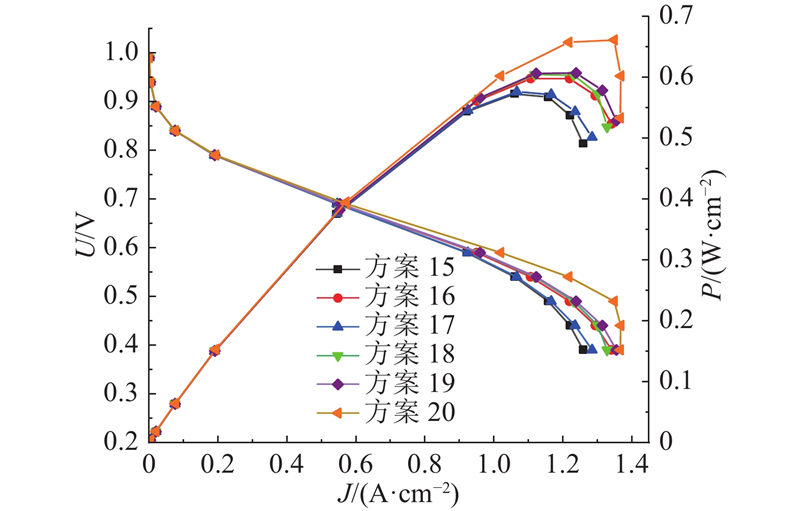
图 21 叶脉流场不同孔隙率分布方案极化曲线与功率密度曲线
Fig.21 Polarization curves and power density curves of different porosity distribution schemes in leaf vein flow fields
3. 结 语
为了研究扩散层孔隙率对传质特性的影响,构建平行、蛇形和叶脉3种不同流场GDL模型,通过调控孔隙率大小和分布,考察催化层氧气摩尔分数、膜电流密度以及极化曲线和功率密度曲线变化规律,得到如下结论. 1)针对平行流场提出的最优GDL孔隙率分布方案,通过增大氧气供应不足处的孔隙率,改善了局部氧气供应不足现象,减小了GDL中低氧气摩尔分数区域的面积,能够有效改善电池输出性能. 2)沿水平方向增加蛇形流场GDL的孔隙率层数可提高催化层中氧气平均摩尔分数和膜电流密度;最佳孔隙率分布方案提高了蛇形流场出口区域的氧气供应,能有效提高电池的电流密度. 3)通过增大叶脉流场气体出口附近对应的GDL孔隙率,改善了催化层中氧气摩尔分数分布均匀性;与常规孔隙率分布相比,该方案的峰值功率密度和电流密度均最优.
参考文献
PEMFC梯度扩散层内两相传输特性的孔隙网络模拟
[J].
Pore network simulation of two-phase transport characteristics in gradient diffusion layer of PEMFC
[J].
阴极扩散层孔隙率不同分布对PEMFC性能的影响
[J].
Influence of different porosity distribution in cathode GDL on FEMFC performance
[J].
扩散层孔隙率对PEMFC性能影响的模拟研究
[J].
Simulation study on the effect of diffusion layer porosity on PEMFC performance
[J].
Influence of catalyst layer and gas diffusion layer porosity in proton exchange membrane fuel cell performance
[J].DOI:10.1016/j.electacta.2021.138793 [本文引用: 1]
Optimization of gas diffusion layer in high temperature PEMFC with the focuses on thickness and porosity
[J].DOI:10.1016/j.apenergy.2021.117357 [本文引用: 1]
气体扩散层孔隙率梯度对质子交换膜燃料电池水管理的影响
[J].
Effect of porosity gradient of gas diffusion layer on water management of PEMFC
[J].
A 3 dimensional numerical model to study the effect of GDL porosity on high temperature PEM fuel cells
[J].DOI:10.1016/j.ijheatmasstransfer.2020.120311 [本文引用: 1]
High molecular weight polybenzimidazole membranes for high temperature PEMFC
[J].DOI:10.1002/fuce.201300070 [本文引用: 1]
The mass transfer characteristics and energy improvement with various partially blocked flow channels in a PEM fuel cell
[J].DOI:10.1016/j.energy.2020.117977 [本文引用: 1]
Optimization of polytetrafluoroethylene content in cathode gas diffusion layer by the evaluation of compression effect on the performance of a proton exchange membrane fuel cell
[J].DOI:10.1016/j.jpowsour.2010.12.090 [本文引用: 1]
扩散层结构对质子交换膜燃料电池性能的影响
[J].
Influence of gas diffusion layer structure on the performance of proton exchange membrane fuel cells
[J].
Numerical investigation of multi-layered porosity in the gas diffusion layer on the performance of a PEM fuel cell
[J].DOI:10.1016/j.ijhydene.2020.05.218 [本文引用: 3]
Numerical study for in-plane gradient effects of cathode gas diffusion layer on PEMFC under low humidity condition
[J].DOI:10.1016/j.ijhydene.2020.05.048 [本文引用: 1]
