|
|
|
| Comparison of accessibility indices for extreme weather events from spatiotemporal perspectives |
Qingchang LU( ),Tu ZHANG,Qin WANG,Biao XU ),Tu ZHANG,Qin WANG,Biao XU |
| School of Electronics and Control Engineering, Chang’an University, Xi’an 710064, China |
|
|
|
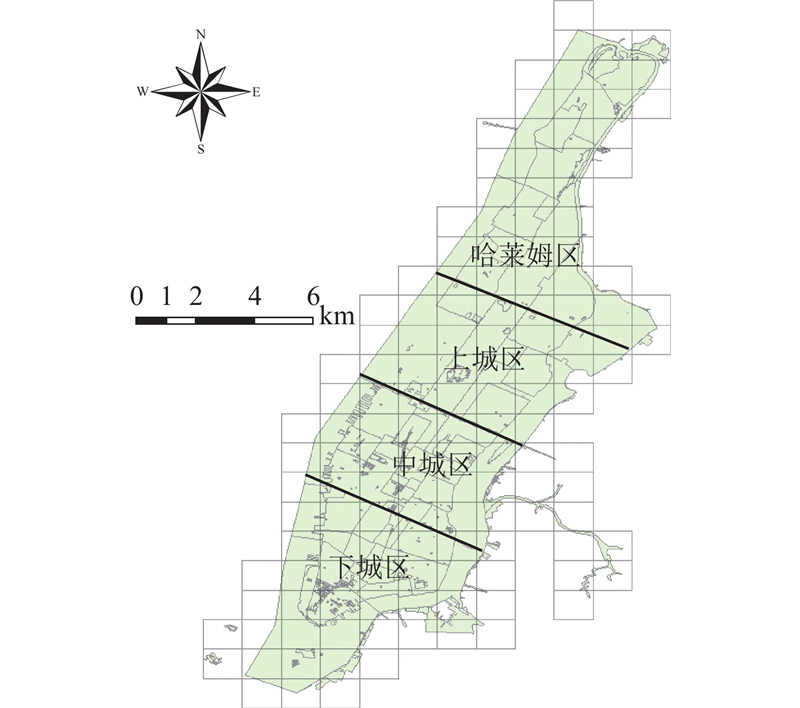
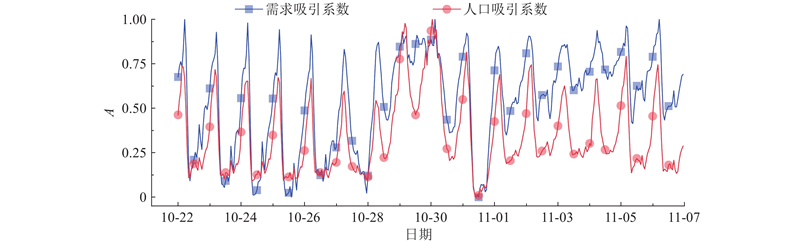
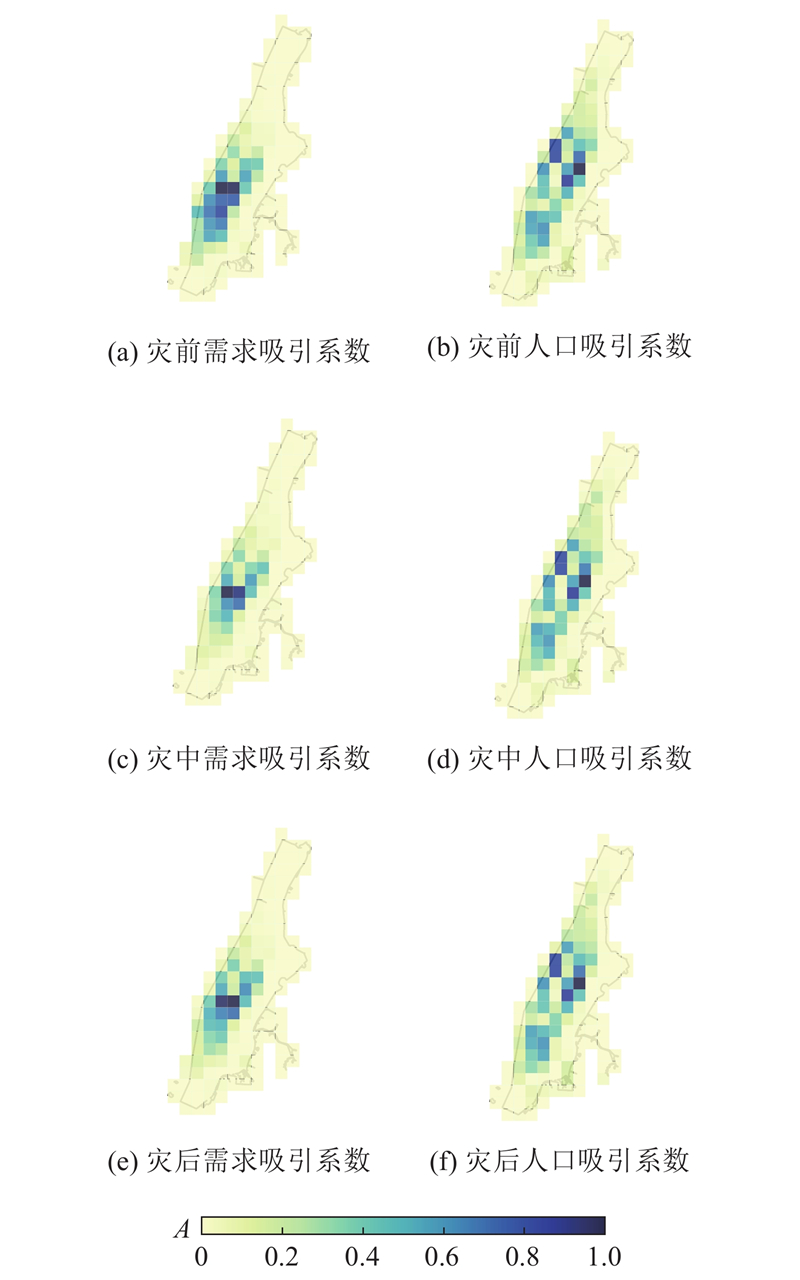
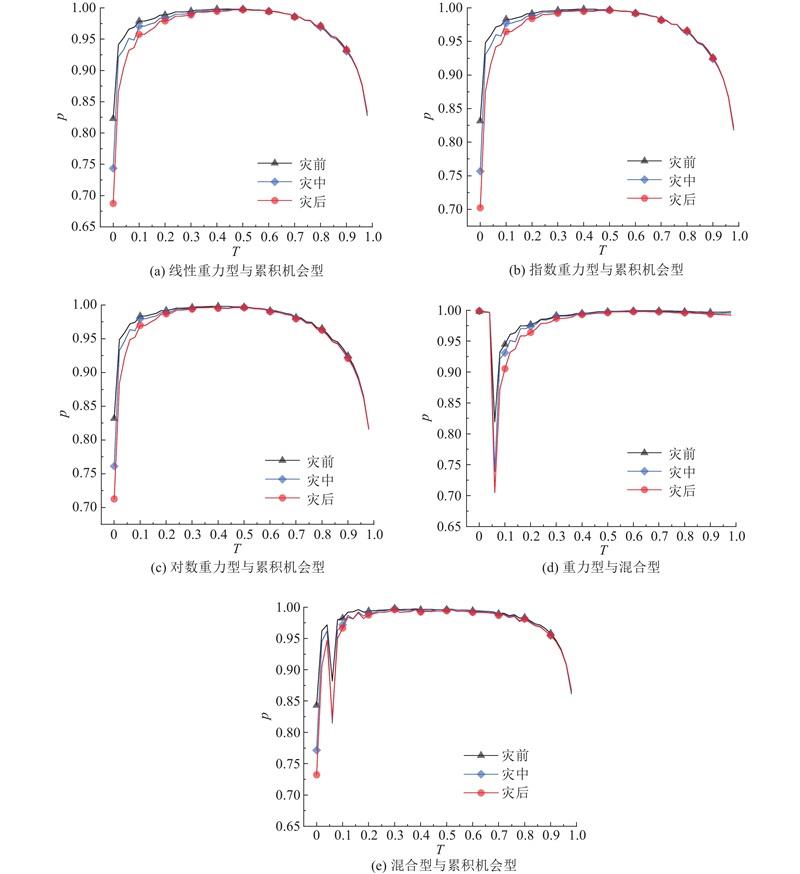
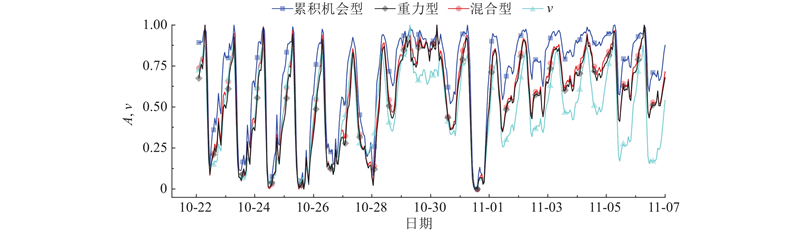
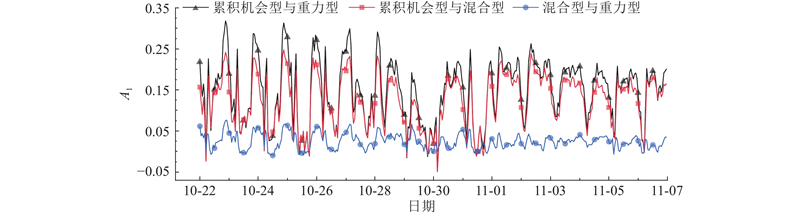
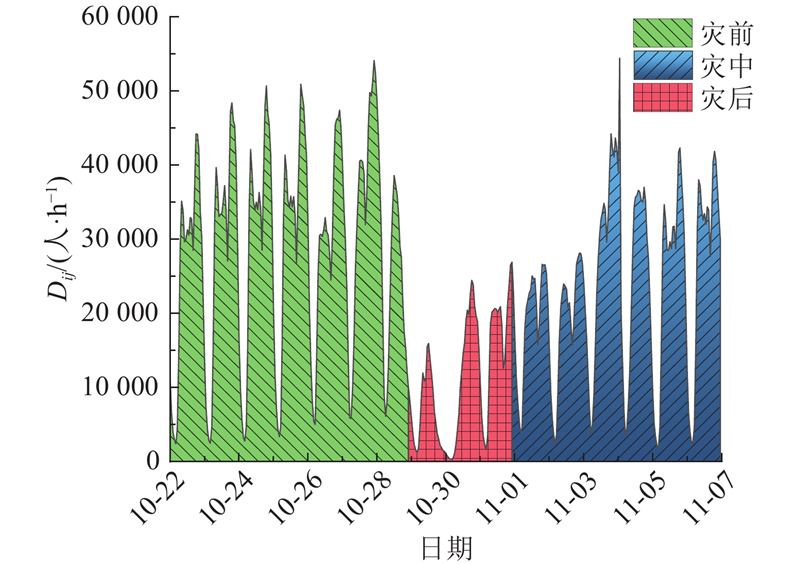
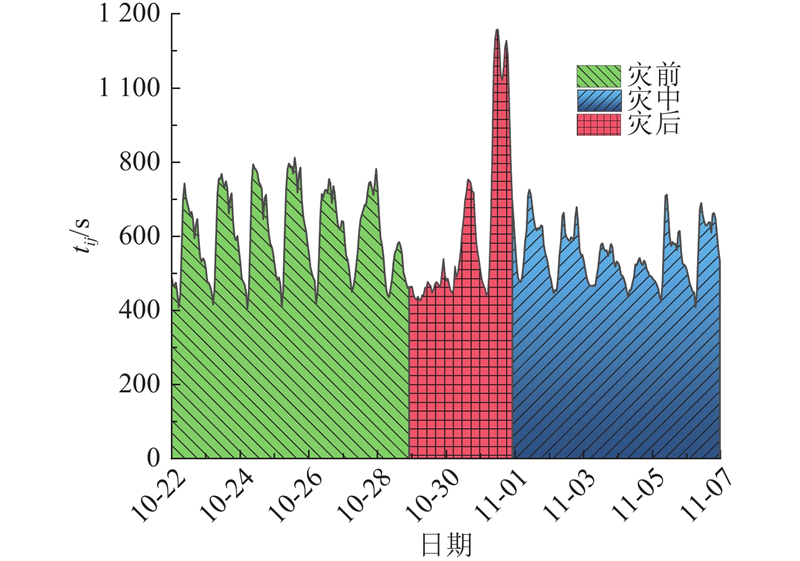
Abstract The performance of various accessibility indices under extreme weather conditions was examined. Utilizing the Hansen accessibility index and taxi trip data from Manhattan during Hurricane Sandy, five types of accessibility indices were compared, focusing on attraction coefficients and impedance functions. The analysis included pre-disaster, during-disaster, and post-disaster accessibility in Manhattan, considering both temporal and spatial dimensions. Comparative findings indicated that demand attraction coefficients reflected the impact of disasters on travel distance, and aligned more effectively with taxi traffic flow changes during disaster scenarios than population-based coefficients. The absolute values of the Pearson correlation coefficients for the three types of impedance function accessibility were all above 0.8, albeit with varying degrees of accessibility. The gravity-type or the hybrid-type impedance function was found to offer a more realistic assessment of accessibility levels during disasters compared to the cumulative opportunity-based functions. Experimental results showed that the demand attraction coefficients and the gravity-type impedance functions captured the variations in taxi traffic flow and travel time characteristics during different disaster stages, while a significant spatiotemporal heterogeneity of extreme weather impacted on the urban road networks was observed. Identifying the applicable conditions of accessibility indices contributes to evaluating road network performance during disasters and guiding post-disaster reconstruction efforts.
|
|
Received: 26 June 2023
Published: 01 July 2024
|
|
|
| Fund: 国家自然科学基金资助项目(71971029);陕西省自然科学研究基础研究计划资助项目(2021JC-28). |
时空角度下极端天气的可达性指标比较
为了确定不同可达性指标在极端天气下的性能,基于Hansen可达性指标,结合飓风“桑迪”期间纽约市曼哈顿区的出租车行程数据,从吸引系数和阻抗函数角度比较5类可达性指标,从时间和空间维度分析曼哈顿区的灾前、灾中、灾后可达性. 比较结果表明,需求吸引系数体现灾害对出行距离的影响,比人口吸引系数更适合描述灾害场景的出租车流量变化特征;3类阻抗函数可达性的皮尔逊相关系数绝对值均大于0.8,但可达性的变化幅度不同;相较于累积机会型阻抗函数,使用重力型或混合型阻抗函数评估的灾害下可达性水平更符合现实情况. 实验结果显示,使用需求吸引系数和重力型阻抗函数分析可达性能够体现灾害不同阶段的出租车流量和行程时间变化特征,极端天气对城市路网的影响存在显著时空异质性. 确定可达性指标的适用条件有助于评估灾害下的路网性能和指导灾后重建工作.
关键词:
城市路网,
极端天气,
可达性指标,
时空异质性,
吸引系数,
阻抗函数
|
|
| [1] |
ILBEIGI M Statistical process control for analyzing resilience of transportation networks[J]. International Journal of Disaster Risk Reduction, 2019, 33: 155- 161
doi: 10.1016/j.ijdrr.2018.10.002
|
|
|
| [2] |
王江波, 苟爱萍 桑迪飓风后纽约的城市发展战略及其启示[J]. 四川建筑, 2020, 40 (1): 12- 13
WANG Jiangbo, GOU Aiping The urban development strategy of New York after Hurricane Sandy and its enlightenment[J]. Sichuan Architecture, 2020, 40 (1): 12- 13
|
|
|
| [3] |
QIANG Y, XU J Empirical assessment of road network resilience in natural hazards using crowdsourced traffic data[J]. International Journal of Geographical Information Science, 2020, 34 (12): 2434- 2450
doi: 10.1080/13658816.2019.1694681
|
|
|
| [4] |
LIAO T Y, HU T Y, KO Y N A resilience optimization model for transportation networks under disasters[J]. Natural Hazards, 2018, 93: 469- 489
doi: 10.1007/s11069-018-3310-3
|
|
|
| [5] |
徐鹏程, 路庆昌, 李静, 等. 连续暴雨灾害下道路网络时变韧性建模与分析 [EB/OL]. (2022-11-03)[2023-06-14]. http://kns.cnki.net/kcms/detail/42.1675.T.20221110.1054.002.html.
|
|
|
| [6] |
JIANG R, LU Q C, PENG Z R A station-based rail transit network vulnerability measure considering land use dependency[J]. Journal of Transport Geography, 2018, 66: 10- 18
doi: 10.1016/j.jtrangeo.2017.09.009
|
|
|
| [7] |
HANSEN W G How accessibility shapes land use[J]. Journal of the American Institute of Planners, 1959, 25 (2): 73- 76
doi: 10.1080/01944365908978307
|
|
|
| [8] |
秦艺帆, 石飞, 徐晓燕 可达性视角下极端天气事件对南京市通勤出行的影响分析[J]. 现代城市研究, 2019, (10): 91- 101
QIN Yifan, SHI Fei, XU Xiaoyan The impact of adverse weather event on commuting trips of Nanjing from the perspective of accessibility[J]. Modern Urban Research, 2019, (10): 91- 101
doi: 10.3969/j.issn.1009-6000.2019.10.012
|
|
|
| [9] |
李睿, 王军, 李梦雅 暴雨内涝情景下城市消防服务可达性的精细化评估[J]. 地理科学进展, 2022, 41 (1): 143- 156
LI Rui, WANG Jun, LI Mengya Fine-resolution evaluation of urban fire service accessibility under the impact of a 100-year pluvial flood[J]. Progress in Geography, 2022, 41 (1): 143- 156
|
|
|
| [10] |
HANDY S Is accessibility an idea whose time has finally come?[J]. Transportation Research Part D: Transport and Environment, 2020, 83: 102319
doi: 10.1016/j.trd.2020.102319
|
|
|
| [11] |
MARTÍN B, ORTEGA E, CUEVAS-WIZNER R, et al Assessing road network resilience: an accessibility comparative analysis[J]. Transportation Research Part D: Transport and Environment, 2021, 95: 102851
doi: 10.1016/j.trd.2021.102851
|
|
|
| [12] |
SIDDIQ F, TAYLOR B D Tools of the trade? Assessing the progress of accessibility measures for planning practice[J]. Journal of the American Planning Association, 2021, 87 (4): 497- 511
doi: 10.1080/01944363.2021.1899036
|
|
|
| [13] |
KELOBONYE K, MCCARNEY G, XIA J, et al Relative accessibility analysis for key land uses: a spatial equity perspective[J]. Journal of Transport Geography, 2019, 75: 82- 93
doi: 10.1016/j.jtrangeo.2019.01.015
|
|
|
| [14] |
YU L, CUI M How subway network affects transit accessibility and equity: a case study of Xi’an metropolitan area[J]. Journal of Transport Geography, 2023, 108: 103556
doi: 10.1016/j.jtrangeo.2023.103556
|
|
|
| [15] |
华晨, 周学文, 李咏华, 等 社区商业设施空间步行可达性评价及布局优化——以绍兴市三区为例[J]. 浙江大学学报: 工学版, 2022, 56 (2): 368- 378
HUA Chen, ZHOU Xuewen, LI Yonghua, et al Spatial walking accessibility evaluation and layout optimization of community commercial facilities: the case of Shaoxing[J]. Journal of Zhejiang University: Engineering Science, 2022, 56 (2): 368- 378
|
|
|
| [16] |
MOYA-GÓMEZ B, SALAS-OLMEDO M H, GARCÍA-PALOMARES J C, et al Dynamic accessibility using big data: the role of the changing conditions of network congestion and destination attractiveness[J]. Networks and Spatial Economics, 2018, 18: 273- 290
doi: 10.1007/s11067-017-9348-z
|
|
|
| [17] |
ZHU Y, DIAO M Crowdsourcing-data-based dynamic measures of accessibility to business establishments and individual destination choices[J]. Transportation Research Part D: Transport and Environment, 2020, 87: 102382
doi: 10.1016/j.trd.2020.102382
|
|
|
| [18] |
PALACIOS M S, EL-GENEIDY A. Cumulative versus gravity-based accessibility measures: which one to use? [EB/OL]. (2022-02-11) [2023-06-14]. https://doi.org/10.32866/001c.32444.
|
|
|
| [19] |
KAPATSILA B, PALACIOS M S, GRISÉ E, et al Resolving the accessibility dilemma: comparing cumulative and gravity-based measures of accessibility in eight Canadian cities[J]. Journal of Transport Geography, 2023, 107: 103530
doi: 10.1016/j.jtrangeo.2023.103530
|
|
|
| [20] |
KLAR B, LEE J, LONG J A, et al The impacts of accessibility measure choice on public transit project evaluation: a comparative study of cumulative, gravity-based, and hybrid approaches[J]. Journal of Transport Geography, 2023, 106: 103508
doi: 10.1016/j.jtrangeo.2022.103508
|
|
|
| [21] |
NYC Taxi and Limousine Commission. TLC trip record data. [EB/OL]. [2023-06-14]. https://www.nyc.gov/site/tlc/about/tlc-trip-record-data.page.
|
|
|
| [22] |
DONOVAN B, WORK D B Empirically quantifying city-scale transportation system resilience to extreme events[J]. Transportation Research Part C: Emerging Technologies, 2017, 79: 333- 346
doi: 10.1016/j.trc.2017.03.002
|
|
|
| [23] |
Worldpop. Worldpop population data. [EB/OL]. [2023-06-14]. https://hub.worldpop.org/.
|
|
|
| [24] |
吴屹豪, 庄宇. 高密度城市人口动静集聚与街坊形态关联解析——基于曼哈顿的实证[EB/OL]. (2023-02-27)[2023-06-14]. http://kns.cnki.net/kcms/detail/11.2378.tu.20230224.1507.002.html.
|
|
|
| [25] |
PAN X, DANG Y, WANG H, et al Resilience model and recovery strategy of transportation network based on travel OD-grid analysis[J]. Reliability Engineering and System Safety, 2022, 223: 108483
doi: 10.1016/j.ress.2022.108483
|
|
|
| [26] |
邓广然. 基于多交通模式旅游景点可达性研究——以武汉都市发展区为例[D]. 武汉: 武汉大学, 2019.
DENG Guangran. Study on tourist attractions accessibility based on multiple transportation modes: a case study of Wuhan metropolitan development zone [D]. Wuhan: Wuhan University, 2019.
|
|
|
|
Viewed |
|
|
|
Full text
|
|
|
|
|
Abstract
|
|
|
|
|
Cited |
|
|
|
|
| |
Shared |
|
|
|
|
| |
Discussed |
|
|
|
|