| Civil Engineering, Traffic Engineering |
|


|
|
|
| Regional integration of Qianzhong cities using highway big data |
Fen-jie LONG1,2,3( ),Long-fei ZHENG1,3,Lang SHI1,3,Zi-yan CHEN1,3 ),Long-fei ZHENG1,3,Lang SHI1,3,Zi-yan CHEN1,3 |
1. Hang Lung Center for Real Estate, Tsinghua University, Beijing 100084, China
2. Guizhou Institute of Technology, Guiyang 550003, China
3. Department of Construction Management , Tsinghua University, Beijing 100084, China |
|
|
|
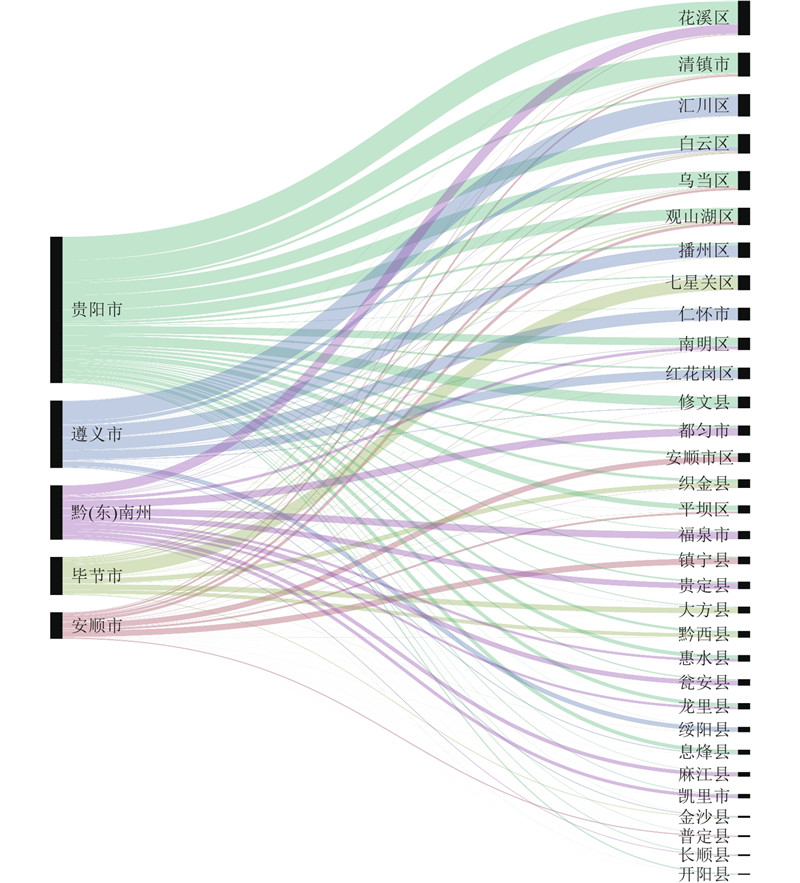
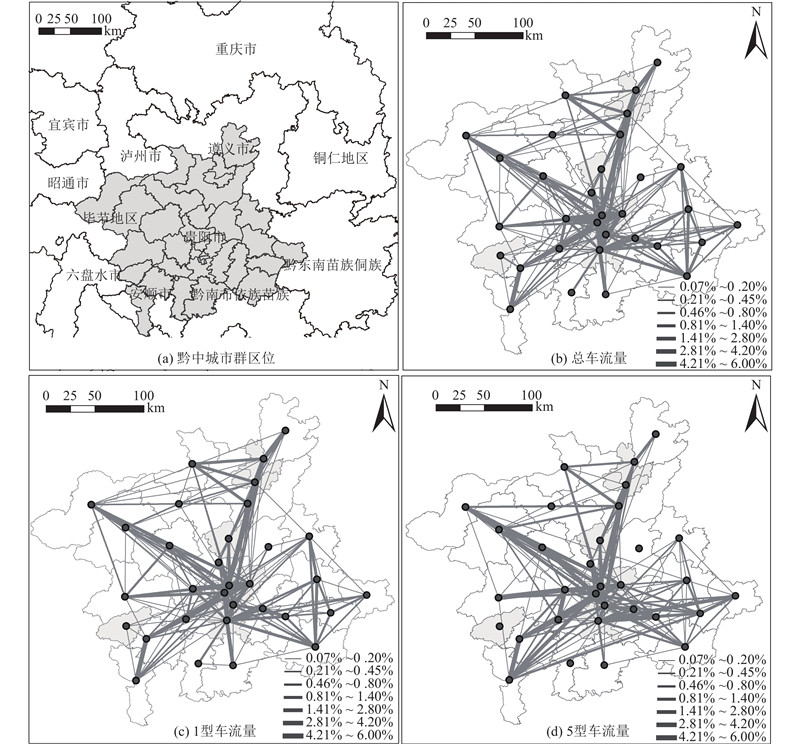
Abstract The core of regional integration is the free flow of production factors among various cities, and the flows of production factors such as labor and trade between cities are important indexes of urban integration of city group. The traffic flows among the 33 counties (districts) of 5 prefecture-level cities in the Qianzhong cities were calculated to reflect the labor and trade flows among districts and counties, according to the collection of 16 783 229 toll data of 165 highway toll stations in the Qianzhong cities from April 1, 2016 to December 30, 2016. The toll data were placed under the framework of the gravity model, and the administrative areas, population, distance and other interference factors were controlled. The degree of regional integration in the Qianzhong cities was analyzed with the criterion that whether administrative boundary had great impact on labor and trade flows or not. Results showed that the overall integration of Qianzhong cities was relatively low, and the administrative boundary had a significant negative impact on labor and trade flows. For the first time, the degree of regional integration of the Qianzhong cities was analyzed through highway big data, and a new perspective and method for the assessment of the regional integration was provided. This method can solve the problems of subjective dependence and lack of micro-information in previous studies.
|
|
Received: 26 January 2018
Published: 21 February 2019
|
|
|
基于公路大数据的黔中城市群一体化研究
城市群一体化的核心是要素在城市间无障碍地自由流通,城市间人员、货物等要素的流量是测度城市群一体化程度的重要指标. 通过收集2016年4月1日至12月30日黔中城市群辖区内165个高速公路收费站16 783 229条收费数据,汇总城市群内5个地级市(州)33个区县之间的车流往来数量,计算各区县之间的贸易和人员流量. 将其置于重力模型框架下,在控制行政面积、人口、距离等干扰因素的条件下,依据行政边界是否对人员和贸易流量存在显著影响来测度黔中城市群的一体化程度. 结果表明,黔中城市群整体上一体化程度较低,行政边界对人员和贸易流量均存在显著的负向影响. 首次通过高速公路大数据对黔中城市群一体化程度进行分析,为城市群一体化的评价提供了新的视角和方法,解决了以往研究中存在的主观性依赖和微观信息缺失的问题.
关键词:
黔中城市群,
区域一体化,
重力模型,
公路大数据,
泊松回归
|
|
| [1] |
李雪松, 孙博文 长江中游城市群区域一体化的测度与比较[J]. 长江流域资源与环境, 2013, 22 (8): 996- 1003
LI Xue-song, SUN Bo-wen Regional integration of the Yangtze River middle reaches urban agglomerations: measuring and comparison[J]. Resources & Environment in the Yangtze Basin, 2013, 22 (8): 996- 1003
|
|
|
| [2] |
崔功豪 中国区域规划的新特点和发展趋势[J]. 现代城市研究, 2006, 21 (9): 4- 7
CUI Gong-hao The new characteristics and development trends of China regional planning[J]. Modern Urban Research, 2006, 21 (9): 4- 7
doi: 10.3969/j.issn.1009-6000.2006.09.001
|
|
|
| [3] |
BALASSA B A The theory of economic integration[J]. Journal of Political Economy, 1961, 29 (1): 47
|
|
|
| [4] |
王珏, 陈雯 全球化视角的区域主义与区域一体化理论阐释[J]. 地理科学进展, 2013, 32 (7): 1082- 1091
WANG Jue, CHEN Wen Implication of regionalism and regional integration under the global shift[J]. Progress in Geography, 2013, 32 (7): 1082- 1091
|
|
|
| [5] |
KAHOULI B Regional integration agreements, trade flows and economic crisis: a static and dynamic gravity model[J]. International Economic Journal, 2016, 72 (1): 1- 26
|
|
|
| [6] |
王安平 产业一体化的内涵与途径——以南昌九江地区工业一体化为实证[J]. 经济地理, 2014, 34 (9): 93- 98
WANG An-ping The connotation and development path of industrial integration-take the industrial integration in Nanchang-Jiujiang region as the case[J]. Economic Geography, 2014, 34 (9): 93- 98
|
|
|
| [7] |
鲁晓东, 李荣林. 区域经济一体化、FDI与国际生产转移:一个自由资本模型[J]. 经济学, 2009, 8(3): 1475–1496.
LU Xiao-dong, LI Rong-lin. Regional integration, FDI and international production location: a footloose capital model [J]. China Economic Quarterly, 2009, 8(3): 1475–1496.
|
|
|
| [8] |
ARRIBAS I, PERES F, TORTOSA-AUSINA E Measuring globalization of international trade: theory and evidence[J]. World Development, 2009, 37 (1): 127- 145
doi: 10.1016/j.worlddev.2008.03.009
|
|
|
| [9] |
KAUFFMANN A Is the ‘central german metropolitan region’ spatially integrated? an empirical assessment of commuting relations[J]. Urban Studies, 2016, 53 (9): 1853- 1868
doi: 10.1177/0042098015581124
|
|
|
| [10] |
陈乐, 李郇, 杜志威, 等 长株潭一体化经济增长的空间效应[J]. 经济地理, 2016, 36 (8): 64- 72
CHEN Le, LI Xun, DU Zhi-wei, et al Spatial effect of economic growth in Chang-Zhu-Tan integrated area[J]. Economic Geography, 2016, 36 (8): 64- 72
|
|
|
| [11] |
刘生龙, 胡鞍钢 交通基础设施与中国区域经济一体化[J]. 经济研究, 2011, (3): 72- 82
LIU Sheng-long, HU An-gang Transportation infrastructure and regional economic integration in China[J]. Economic Research Journal, 2011, (3): 72- 82
doi: 10.3969/j.issn.1674-9448.2011.03.007
|
|
|
| [12] |
马明辉, 杨庆芳, 梁士栋, 等 高速公路主线瓶颈区域的协调控制模型[J]. 浙江大学学报: 工学版, 2015, 49 (9): 1700- 1706
MA Ming-hui, YANG Qing-fang, LIANG Shi-dong, et al Coordinated control model for freeway mainline bottleneck zone[J]. Journal of Zhejiang University: Engineering Science, 2015, 49 (9): 1700- 1706
|
|
|
| [13] |
TOBLER W R A computer movie simulating urban growth in the Detroit region[J]. Economic Geography, 1970, 46 (Suppl. 1): 234- 240
|
|
|
| [14] |
HILBE J Negative binomial regression[J]. Journal of the Royal Statistical Society, 2011, 171 (3): 758- 759
|
|
|
|
Viewed |
|
|
|
Full text
|
|
|
|
|
Abstract
|
|
|
|
|
Cited |
|
|
|
|
| |
Shared |
|
|
|
|
| |
Discussed |
|
|
|
|