1. Shaanxi Engineering Laboratory for Industrial Design, Northwestern Polytechnical University, Xi'an 710072, China 2. China Aviation Industry First Aircraft Design Institute, Xi'an 710089, China
The raw data with sampling density of 32×32 was spatially filtered to eliminate noise, in order to enhance the continuity of data distribution between independent sensors. Then sampling density of data was decreased to 24×24, 16×16, and 8×8, respectively. Four common features (mean pressure, maximum pressure, mean pressure gradient, and maximum pressure gradient) were calculated at each sampling density. The one-way ANOVA analysis showed that the differences of mean values between 32×32 sampling density and 24×24 as well as 16×16 sampling densities were small (1.1 mmHg, 2.6 mmHg), but the difference of mean value between 32×32 and 8×8 sampling densities was big (9.0 mmHg). Spearman correlation analysis revealed that the four common features of 32×32 sampling density had high correlation with that of 24×24, 16×16, and 8×8 sampling densities (P<0.05). The highest was the peak pressure correlation (0.99,P<0.05) between the 32 ×32 and 24 ×24 sampling densities, and the lowest was the mean pressure gradient correlation (0.55,P<0.05) between the 32×32 and 8×8 sampling densities. The test results showed that the pressure mat with the sampling density of 24×24 and 16×16 can provide accurate body pressure distribution characteristics.
Chuan ZHAO,Sui-huai YU,Lei WANG,Wen-hua LI. Body pressure distribution characteristics in different sampling densities. Journal of ZheJiang University (Engineering Science), 2019, 53(2): 268-274.
Tab.1Anthropometric dimensions of volunteers included in study
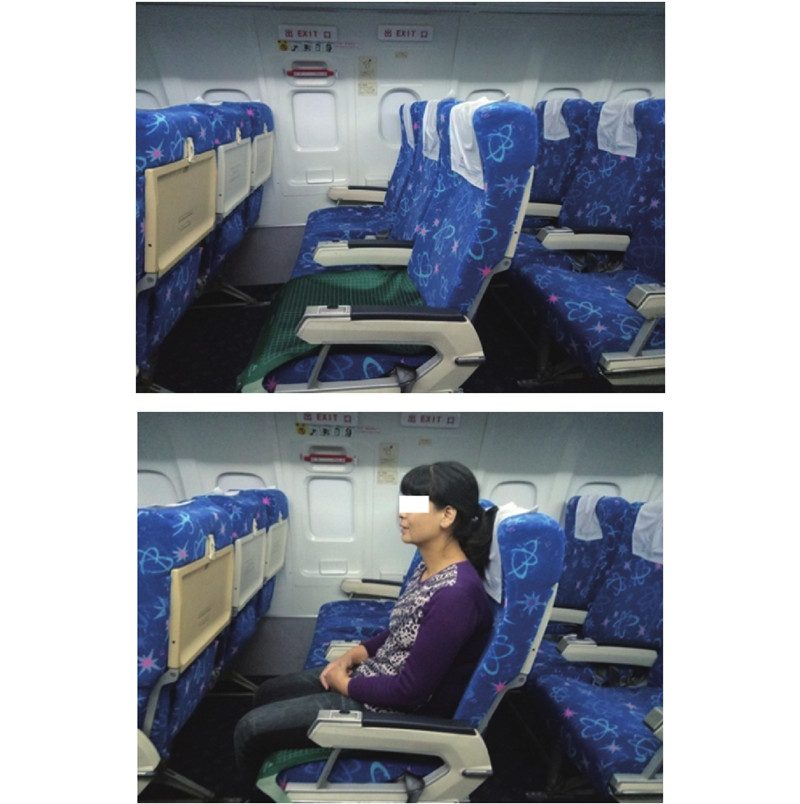
Fig.1Aircraft cabin simulation scenario and experiment process
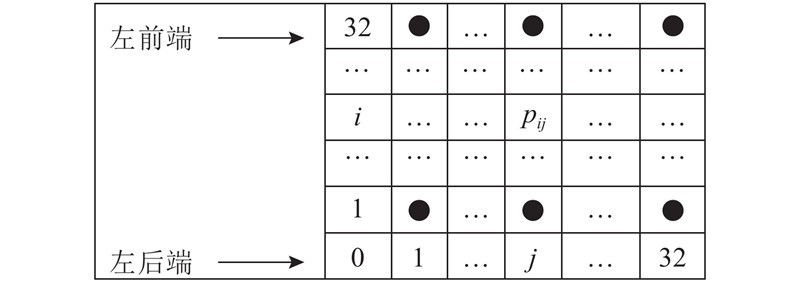
Fig.2Pressure mat sensor distribution map
Fig.3Spatial filtering processing results of pressure mat data
Fig.4Pressure mapping image of body pressure distribution data
座椅间距/cm
32×32
24×24
pmax/ mmHg
pmean/ mmHg
Gmax/ (mmHg·m?1)
Gmean/ (mmHg·m?1)
pmax/ mmHg
pmean/ mmHg
Gmax/ (mmHg·m?1)
Gmean/ (mmHg·m?1)
71.12
32.13
25.72
10.11
8.21
31.93
27.65
12.47
9.99
76.20
32.23
27.65
10.38
7.48
32.46
25.63
12.48
9.15
81.28
35.62
28.47
10.54
8.21
35.97
28.14
14.20
9.87
86.36
36.26
28.41
11.69
8.34
36.16
28.40
14.23
10.13
91.44
37.33
29.87
12.36
8.48
37.68
28.89
15.00
10.29
座椅间距/cm
16×16
8×8
pmax/ mmHg
pmean/ mmHg
Gmax/ (mmHg·m?1)
Gmean/ (mmHg·m?1)
pmax/ mmHg
pmean/ mmHg
Gmax/ (mmHg·m?1)
Gmean/ (mmHg·m?1)
71.12
32.72
28.39
15.98
12.70
34.78
29.67
24.41
19.60
76.20
34.12
26.24
16.51
11.94
38.02
27.07
26.44
18.79
81.28
38.48
28.96
19.35
12.81
40.85
30.57
28.95
20.31
86.36
39.09
29.41
19.20
13.17
41.12
30.65
29.21
21.56
91.44
39.16
30.13
20.08
13.46
43.76
31.99
29.67
21.57
Tab.2Pressure distribution parameters
对照组 采样密度
试验组 采样密度
pmean均值差
P
95%置信区间
下限
上限
注:1) 与对照组比较,P<0.05
32×32
8×8
?9.01)
0.03
?17.18
?0.78
32×32
16×16
?2.6
0.66
?11.78
4.63
32×32
24×24
?1.1
0.99
?9.26
7.14
Tab.3Results of one-way ANOVA of average pressure at different sampling intensities
32×32体压分布采样密度 对应特征值
24×24
16×16
8×8
pmax
pmean
Gmax
Gmean
pmax
pmean
Gmax
Gmean
pmax
pmean
Gmax
Gmean
注:与对照组比较,均有P<0.05
pmax
0.99
0.88
0.76
0.84
0.94
0.88
0.70
0.81
0.85
0.88
0.78
0.76
pmean
0.85
0.99
0.55
0.94
0.76
0.98
0.48
0.89
0.61
0.96
0.60
0.86
Gmax
0.78
0.55
0.99
0.59
0.78
0.56
0.94
0.58
0.74
0.56
0.88
0.55
Gmean
0.84
0.96
0.61
0.99
0.76
0.94
0.57
0.96
0.63
0.92
0.68
0.92
Tab.4Spearman correlation analysis results of pressure distribution
[1]
张毅, 王和平 民用客机总体方案评价准则研究[J]. 西北工业大学学报, 2006, 24 (6): 791- 794 ZHANG Yi, WANG He-ping Some suggesion evalution preliminary overall design of chinese passenger aircraft[J]. Journal of Northwestern Polytechnical University, 2006, 24 (6): 791- 794
doi: 10.3969/j.issn.1000-2758.2006.06.026
[2]
CILOGLU H, ALZIADEH M, MOHANY A, et al Assessment of the whole body vibration exposure and the dynamic seat comfort in passenger aircraft[J]. International Journal of Industrial Ergonomics, 2015, 45 (7): 116- 123
[3]
RICHARDS L G, JACOBSON I D, KUHLTHAU A R What the passenger contributes to passenger comfort[J]. Applied Ergonomics, 1978, 9 (3): 137- 142
doi: 10.1016/0003-6870(78)90003-0
[4]
VINK P. Aircraft interior comfort and design [M]. Boca Raton: CRC Press, 2011.
[5]
铃木浩明, 管永利 列车舒适度的评价[J]. 国外铁道车辆, 1999, (2): 26- 32 LINGMU hao-ming, GUAN Yong-li The evaluation of trian comfort[J]. Foreign Rolling Stock, 1999, (2): 26- 32
[6]
马佳, 柯艺杰, 苏强, 等 汽车座椅舒适度人工智能评价方法研究[J]. 机械科学与技术, 2011, 30 (3): 419- 422 MA Jia, KE Yi-jie, SU qiang, et al An automobile seat comfort evalution method based on artificial intelligence[J]. Mechanical Science and Technology for Aerospace Engineering, 2011, 30 (3): 419- 422
[7]
LAI Y H, SUE M W, GUO L Y A novel evaluation platform for the evaluation of anti-ulcers mattress[J]. Gerontechnology, 2014, 13 (2): 232
[8]
ANDRADE Y N. An ergonomic evaluation of aircraft pilot seats [D]. Daytona Beach: Embry Riddle Aeronautical University, 2013.
[9]
CIACCIA F R D A S, SZNELWAR L I An approach to aircraft seat comfort using interface pressure mapping[J]. Work, 2012, 41 (Suppl. 1): 240- 245
[10]
LI W, YU S, YANG H, et al Effects of long-duration sitting with limited space on discomfort, body flexibility, and surface pressure[J]. International Journal of Industrial Ergonomics, 2017, 58: 12- 24
doi: 10.1016/j.ergon.2017.01.002
[11]
STINSON M D, PORTER-ARMSTRONG A, EAKIN P Seat-interface pressure: a pilot study of the relationship to gender, body mass index, and seating position[J]. Archives of Physical Medicine and Rehabilitation, 2003, 84 (3): 405- 409
doi: 10.1053/apmr.2003.50011
[12]
VOS G A, CONGLETON J J, MOORE J S, et al Postural versus chair design impacts upon interface pressure[J]. Applied Ergonomics, 2006, 37 (5): 619- 628
doi: 10.1016/j.apergo.2005.09.002
[13]
KOLICH M, SEAL N, TABOUN S Automobile seat comfort prediction: statistical model vs artificial neural network[J]. Applied Ergonomics, 2004, 35 (3): 275- 284
doi: 10.1016/j.apergo.2004.01.007
[14]
ZHAO C, YU S, MILLER C, et al. Predicting aircraft seat comfort using an artificial neural network [J/OL]. Human Factors and Ergonomics in Manufacturing and Service Industries. https://onlinelibrary.wiley.com/doi/full/10.1002/hfm.20767.
[15]
TIMM M, SAMUELSSON K Wheelchair seating: a study on the healthy elderly[J]. Scandinavian Journal of Occupational Therapy, 2016, 23 (6): 458- 466
doi: 10.3109/11038128.2016.1152297
[16]
VERBUNT M, BARTNECK C Sensing senses: tactile feedback for the prevention of decubitus ulcers[J]. Applied Psychophysiology and Biofeedback, 2010, 35 (3): 243- 250
doi: 10.1007/s10484-009-9124-z
[17]
WININGER M, CRANE B A Assessment of the minimally sufficient spatial sampling in pressure mapping the wheelchair seating interface[J]. Technology and Disability, 2015, 27 (4): 119- 125
[18]
HEFFERNAN C, FREIVALDS A Optimum pinch grips in the handling of dies[J]. Applied Ergonomics, 2000, 31 (4): 409- 414
doi: 10.1016/S0003-6870(99)00064-2
[19]
KREMSER F, GUENZKOFER F, SEDLMEIER C, et al Aircraft seating comfort: the influence of seat pitch on passengers’ well-being[J]. Work, 2012, 41 (Suppl. 1): 4936- 4942