| Mathematics and Computer Science |
|


|
|
|
| Representation learning driven multiple graph sampling |
Ruiqi YU1( ),Yuhua LIU1(),Xilong SHEN2,Ruyu ZHAI1,Xiang ZHANG2,Zhiguang ZHOU1 ),Yuhua LIU1(),Xilong SHEN2,Ruyu ZHAI1,Xiang ZHANG2,Zhiguang ZHOU1 |
1.School of Media and Design,Hangzhou Dianzi University,Hangzhou 310018,China
2.School of Information Management and Artificial Intelligence,Zhejiang University of Finance and Economics,Hangzhou 310018,China |
|
|
|
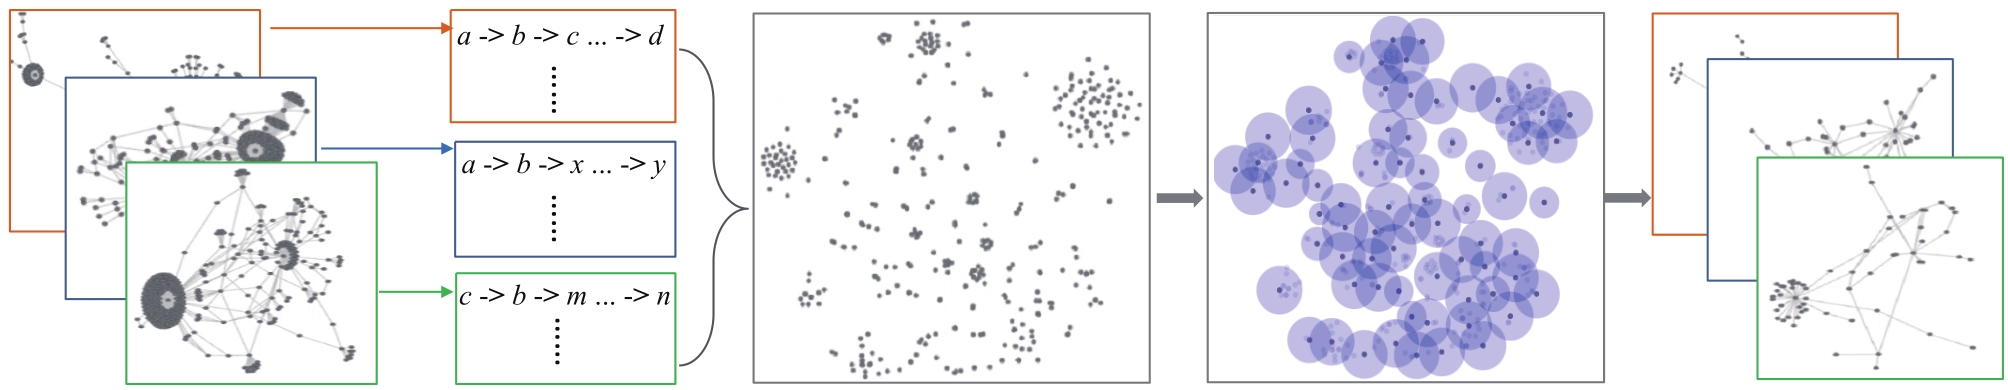
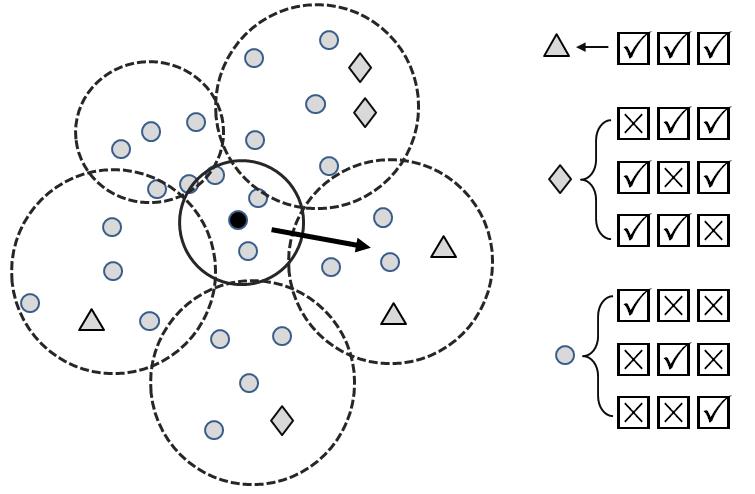
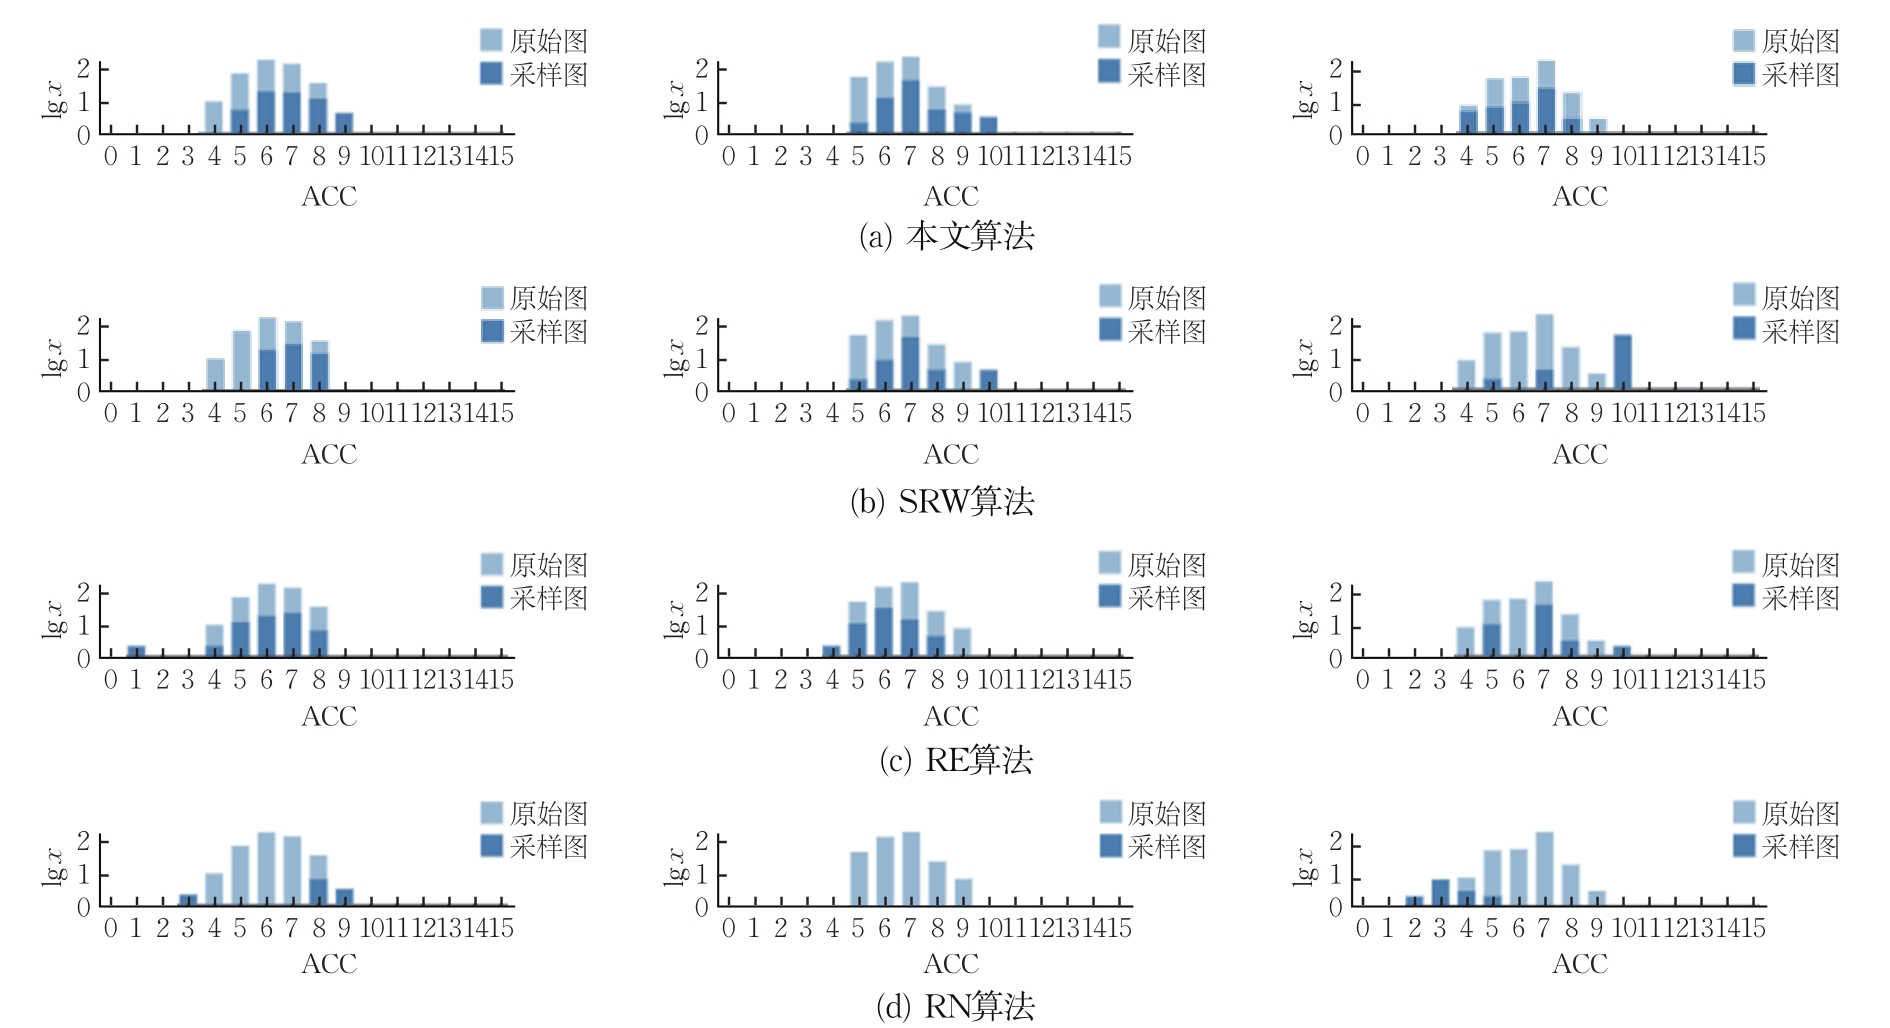
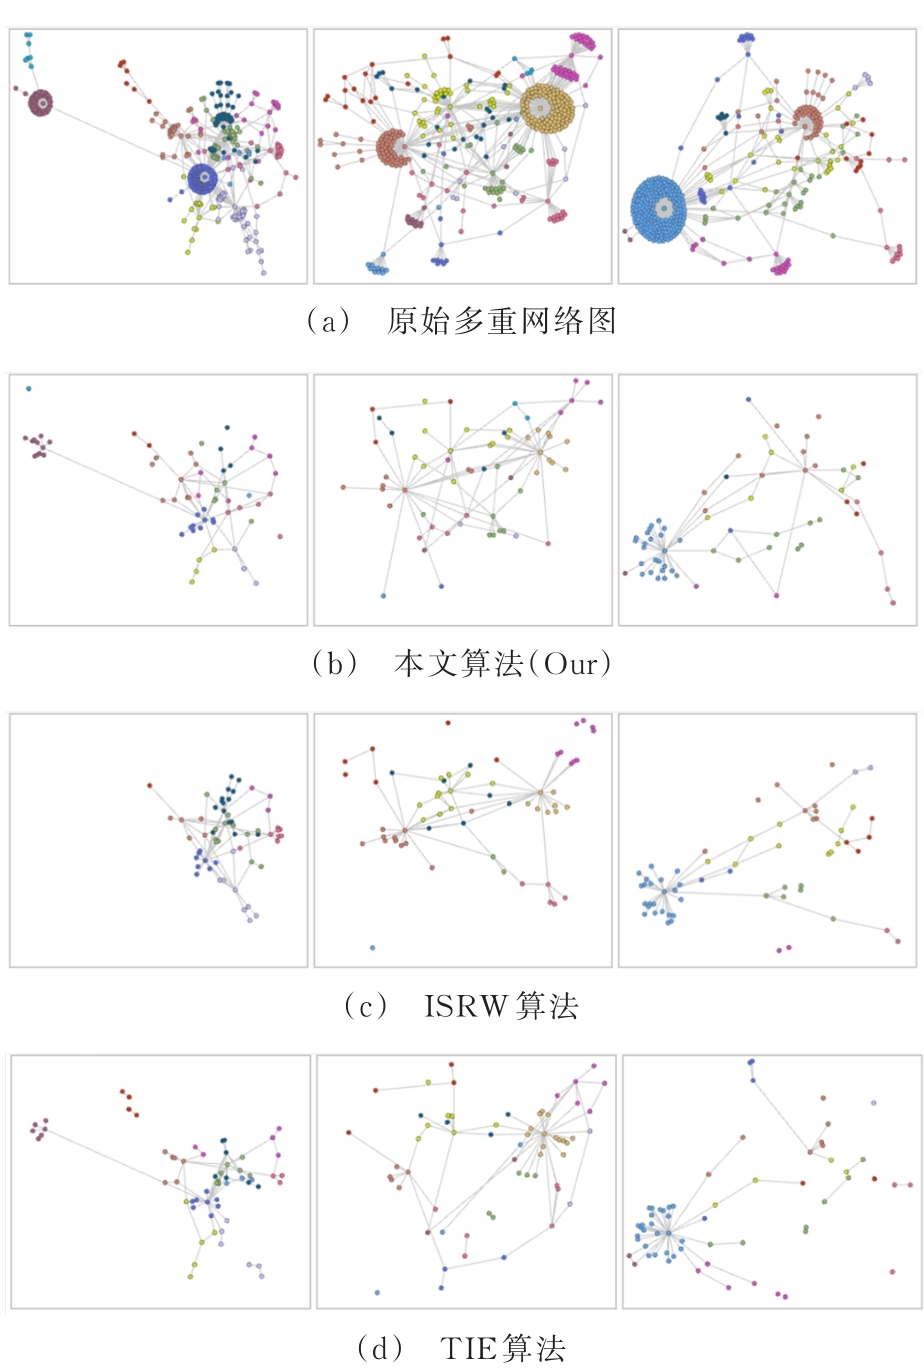
Abstract The existing graph sampling techniques pay attention mainly to single graph sampling, focusing on how to preserve the specific topological features of a graph by sampling, such as node degree, cluster coef?cient, connectivity. With the improvement of data acquisition capability, multiple graphs, namely a set of nodes exhibits different relationships in different scenarios, have become quietly ubiquitous in the real world. To address this problem, a multiple graph sampling driven by representation learning is proposed. First, a graph representation learning method is designed to fuse the structural features of multiple graphs, through which the nodes are projected into a two-dimensional representation learning space. Then, considering node density and network connectivity, an improved the adaptive blue noise sampling algorithm is employed to select nodes from the representation learning space meanwhile simultaneously preserving the contextual structure features of multiple graphs. Furthermore, an interactive visual analytics system is developed allowing users to explore and analyze multiple graph sampling, and visually compare results with various sampling strategies. Case studies and the experimental results based on two real-world datasets have demonstrated the effectiveness of the proposed method in sampling multiple graphs.
|
|
Received: 30 January 2022
Published: 24 May 2022
|
|
|
|
Corresponding Authors:
Yuhua LIU
E-mail: yrq0121@hdu.edu.cn;liuyuhua@hdu.edu.cn
|
|
Cite this article:
Ruiqi YU,Yuhua LIU,Xilong SHEN,Ruyu ZHAI,Xiang ZHANG,Zhiguang ZHOU. Representation learning driven multiple graph sampling. Journal of Zhejiang University (Science Edition), 2022, 49(3): 271-279.
URL:
https://www.zjujournals.com/sci/EN/Y2022/V49/I3/271
|
表征学习驱动的多重网络图采样
已有的图采样方法侧重于单图采样,关注如何在一张图上通过采样保留其特定的拓扑结构特征。随着数据采集能力的提升,多重网络图在实际应用中越来越普遍,即相同的节点集在不同场景中具有不同的网络关系。针对传统图采样方法无法兼顾多重网络图结构特征的问题,提出了表征学习驱动的多重网络图采样算法。首先,设计融合多重网络图结构特征的图表征学习方法,将节点投影至二维的表征学习空间;其次,利用改进的自适应蓝噪声采样算法,考虑节点密度和网络连通性,从表征学习空间筛选节点,以保持其多重网络结构特征及图上下文结构特征。进而开发了一套多重网络图采样可视分析系统,支持用户交互式地探索多重网络图采样,并与已有采样算法进行对比。案例分析和评估实验证明了本文算法在多重网络图采样中的有效性。
关键词:
多重网络图,
图采样,
可视分析,
评估
|
|
| [1] |
ZHOU Z, SHI C, SHEN X, et al. Context-aware sampling of large networks via graph representation learning[J]. IEEE Transactions on Visualization and Computer Graphics, 2020, 27(2): 1709-1719. DOI:10.1109/TVCG.2020.3030440
doi: 10.1109/TVCG.2020.3030440
|
|
|
| [2] |
CHENG K. Sampling from large graphs with a reservoir[C]// Proceedings of the 2014 17th International Conference on Network-Based Information Systems. Los Alamitos: IEEE Computer Society Press, 2014: 347-354. DOI:10. 1109/NBiS.2014.25
doi: 10. 1109/NBiS.2014.25
|
|
|
| [3] |
MAGNANI M, ROSSI L. Formation of multiple networks[C]// International Conference on Social Computing, Behavioral-Cultural Modeling and Prediction. Berlin/Heidelberg: Springer, 2013: 257-264. DOI:10.1007/978-3-642-37210-0_28
doi: 10.1007/978-3-642-37210-0_28
|
|
|
| [4] |
SUN R, ZHANG L, CHEN Z. A sample-based approximate ranking method for large graphs[C]// 2018 6th International Conference on Advanced Cloud and Big Data(CBD). Los Alamitos: IEEE Computer Society Press, 2018: 112-117. DOI:10. 1109/CBD.2018.00029
doi: 10. 1109/CBD.2018.00029
|
|
|
| [5] |
TÜRKOGLU D, TURK A. Edge-based wedge sampling to estimate triangle counts in very large graphs[C]// 2017 IEEE International Conference on Data Mining(ICDM). Los Alamitos: IEEE Computer Society Press, 2017: 455-464. DOI:10. 1109/ICDM.2017.55
doi: 10. 1109/ICDM.2017.55
|
|
|
| [6] |
YOON S H, KIM K N, HONG J, et al. A community-based sampling method using DPL for online social networks[J]. Information Sciences, 2015, 306: 53-69. DOI:10.1016/j.ins. 2015.02.014
doi: 10.1016/j.ins. 2015.02.014
|
|
|
| [7] |
HU J, HONG S H, CHEN J, et al. Connectivity-based spectral sampling for big complex network visualization[C]// International Conference on Complex Networks and Their Applications. Cham: Springer, 2020: 237-248. DOI:10.1007/978-3-030-65347-7_20
doi: 10.1007/978-3-030-65347-7_20
|
|
|
| [8] |
ZHOU Z, MENG L, TANG C, et al. Visual abstraction of large scale geospatial origin-destination movement data[J]. IEEE Transactions on Visualization and Computer Graphics, 2018, 25(1): 43-53. DOI:10.1109/TVCG.2018.2864503
doi: 10.1109/TVCG.2018.2864503
|
|
|
| [9] |
GUO D, ZHU X. Origin-destination flow data smoothing and mapping[J]. IEEE Transactions on Visualization and Computer Graphics, 2014, 20(12): 2043-2052. DOI:10.1109/TVCG.2014. 2346271
doi: 10.1109/TVCG.2014. 2346271
|
|
|
| [10] |
ZHAO Y, JIANG H, CHEN Q, et al. Preserving minority structures in graph sampling[J]. IEEE Transactions on Visualization and Computer Graphics, 2020, 27(2): 1698-1708. DOI:10.1109/TVCG.2020.3030428
doi: 10.1109/TVCG.2020.3030428
|
|
|
| [11] |
MAIYA A S, BERGER-WOLF T Y. Benefits of bias: Towards better characterization of network sampling[C]// Proceedings of the 17th ACM SIGKDD International Conference on Knowledge Discovery and Data Mining. New York: ACM Press, 2011: 105-113. DOI:10.1145/2020408. 2020431
doi: 10.1145/2020408. 2020431
|
|
|
| [12] |
NGUYEN Q H, HONG S H, EADES P, et al. Proxy graph: Visual quality metrics of big graph sampling[J]. IEEE Transactions on Visualization and Computer Graphics, 2017, 23(6): 1600-1611. DOI:10.1109/TVCG.2017.2674999
doi: 10.1109/TVCG.2017.2674999
|
|
|
| [13] |
WU Y, CAO N, ARCHAMBAULT D, et al. Evaluation of graph sampling: A visualization perspective[J]. IEEE Transactions on Visualization and Computer Graphics, 2016, 23(1): 401-410. DOI:10.1109/TVCG.2016.2598867
doi: 10.1109/TVCG.2016.2598867
|
|
|
| [14] |
ZHANG F Y, ZHANG S, WONG P C, et al. A visual evaluation study of graph sampling techniques[J]. Electronic Imaging, 2017, 2017(1): 110-117. DOI:10.2352/ISSN.2470-1173.2017.1.VDA-394
doi: 10.2352/ISSN.2470-1173.2017.1.VDA-394
|
|
|
| [15] |
ZHANG D, YIN J, ZHU X, et al. Network representation learning: A survey[J]. IEEE Transactions on Big Data, 2020, 6(1): 3-28. DOI:10.1109/TBDATA.2018.2850013 .
doi: 10.1109/TBDATA.2018.2850013
|
|
|
| [16] |
PEROZZI B, AL-RFOU R, SKIENA S. Deepwalk: online learning of social representations[C]// Proceedings of the 20th ACM SIGKDD International Conference on Knowledge Discovery and Data Mining. New York: ACM Press, 2014: 701-710. DOI:10.1145/2623330.2623732
doi: 10.1145/2623330.2623732
|
|
|
| [17] |
GROVER A, LESKOVEC J. Node2vec: Scalable feature learning for networks[C]// Proceedings of the 22th ACM SIGKDD International Conference on Knowledge Discovery and Data Mining. New York: ACM Press, 2016: 855-864. DOI:10.1145/2939672.2939754
doi: 10.1145/2939672.2939754
|
|
|
| [18] |
WANG Y, CHEN L, JO J, et al. Joint t-SNE for comparable projections of multiple high-dimensional datasets[J]. IEEE Transactions on Visualization and Computer Graphics, 2022, 28(1): 623-632. DOI:10.1109/TVCG.2021.3114765 .
doi: 10.1109/TVCG.2021.3114765
|
|
|
|
Viewed |
|
|
|
Full text
|
|
|
|
|
Abstract
|
|
|
|
|
Cited |
|
|
|
|
| |
Shared |
|
|
|
|
| |
Discussed |
|
|
|
|