| 数学与计算机科学 |
|


|
|
|
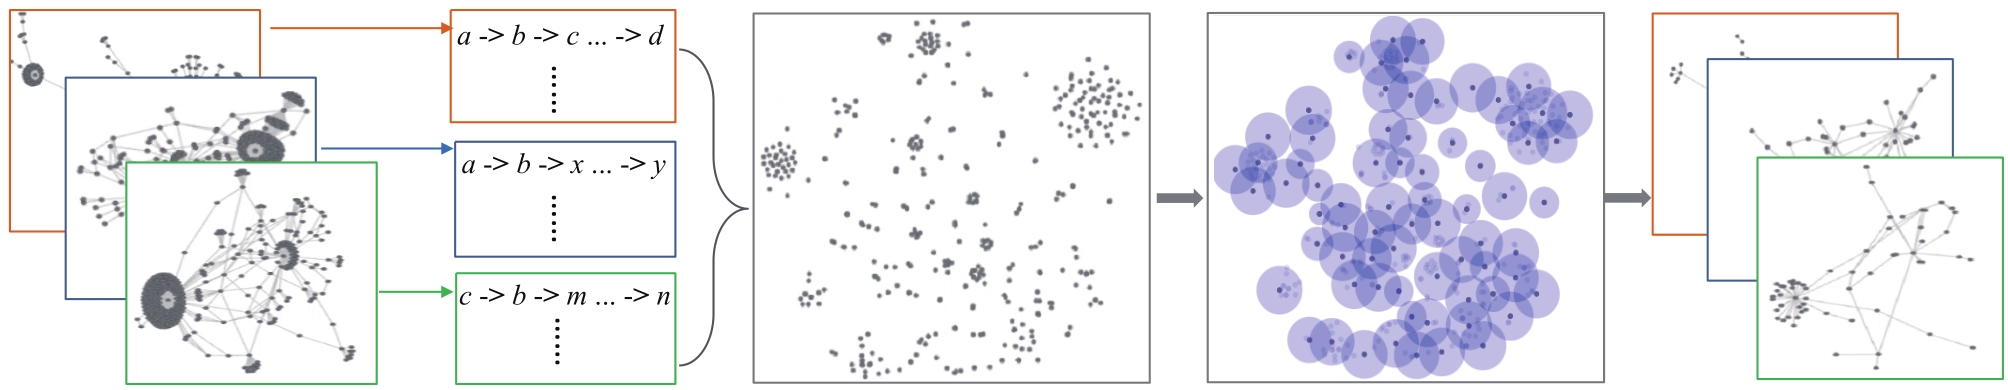
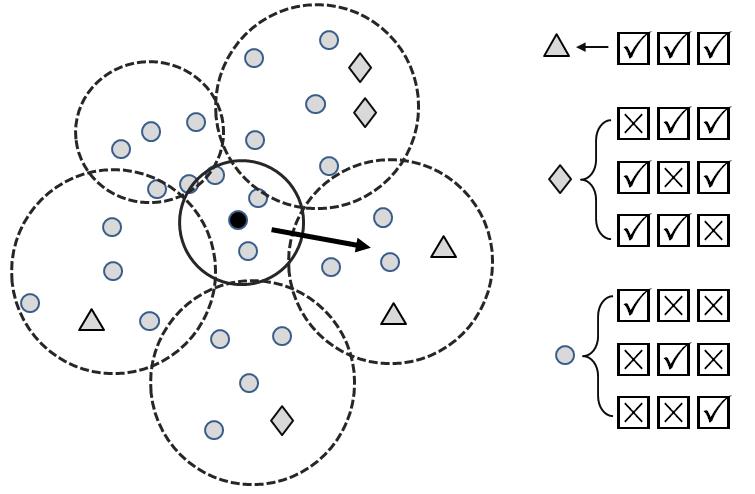
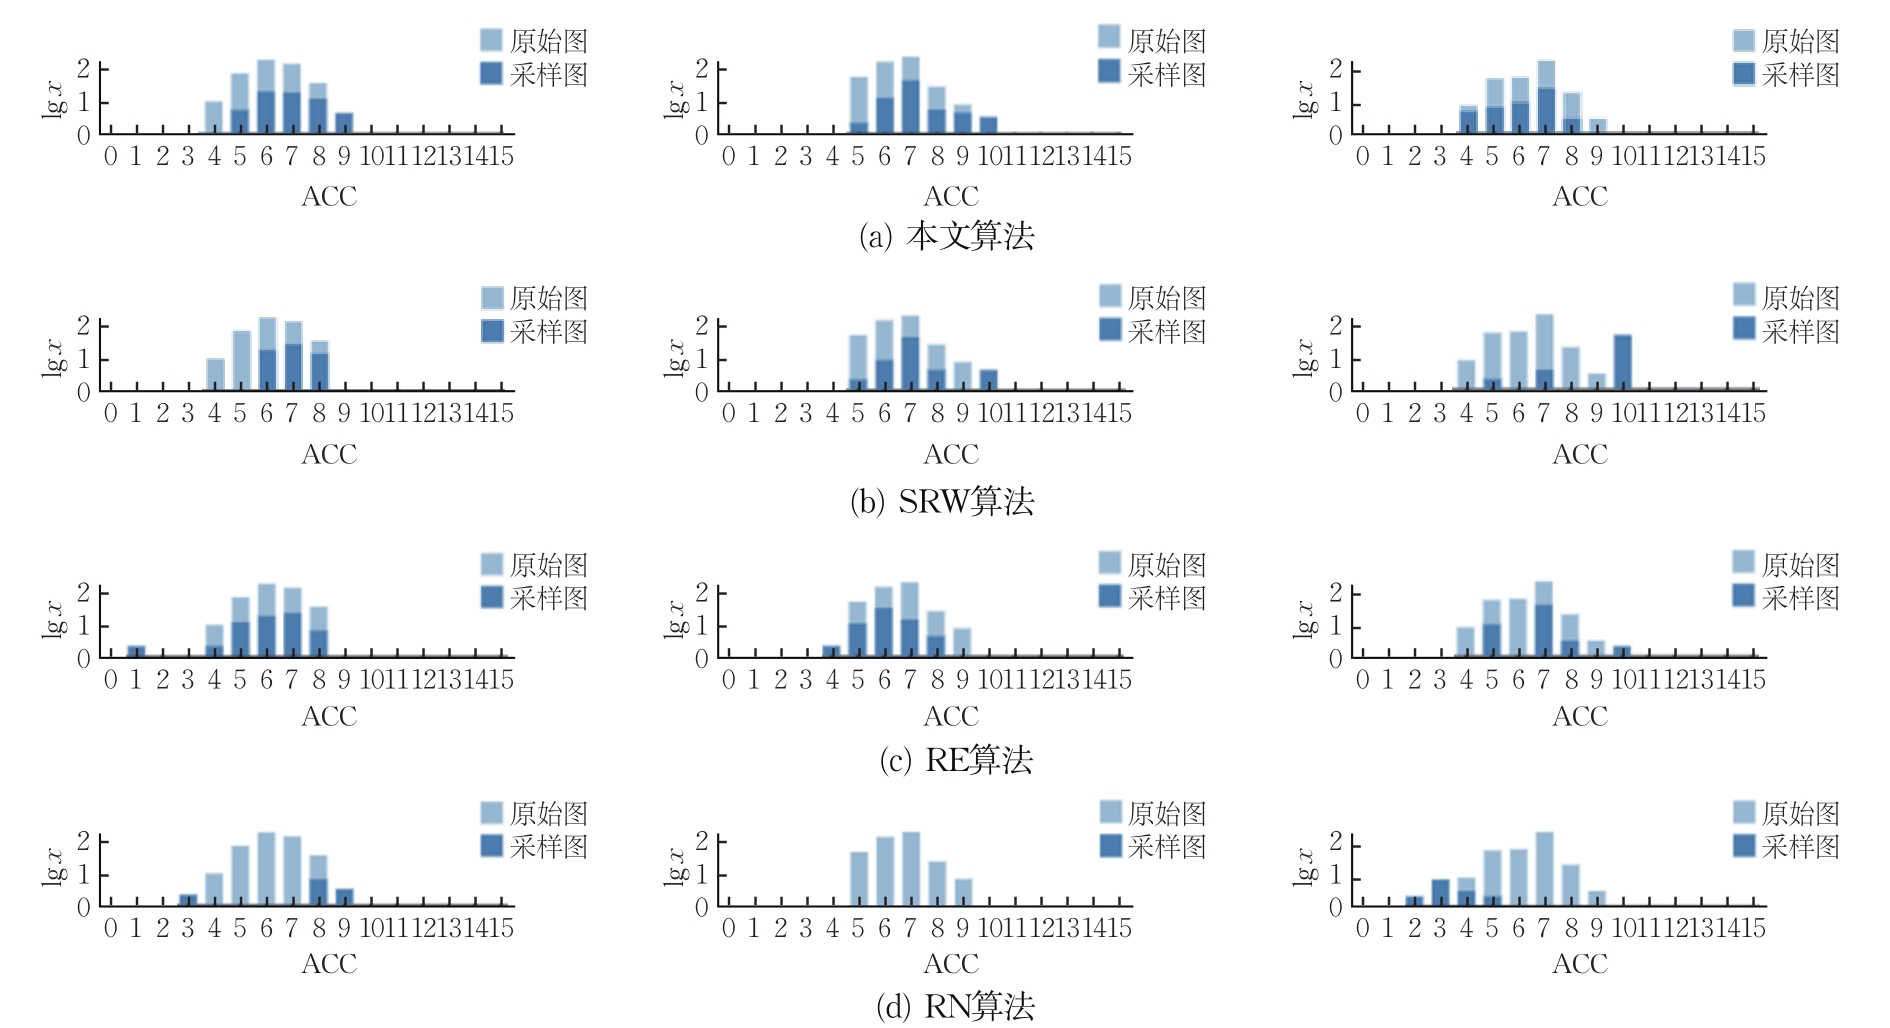
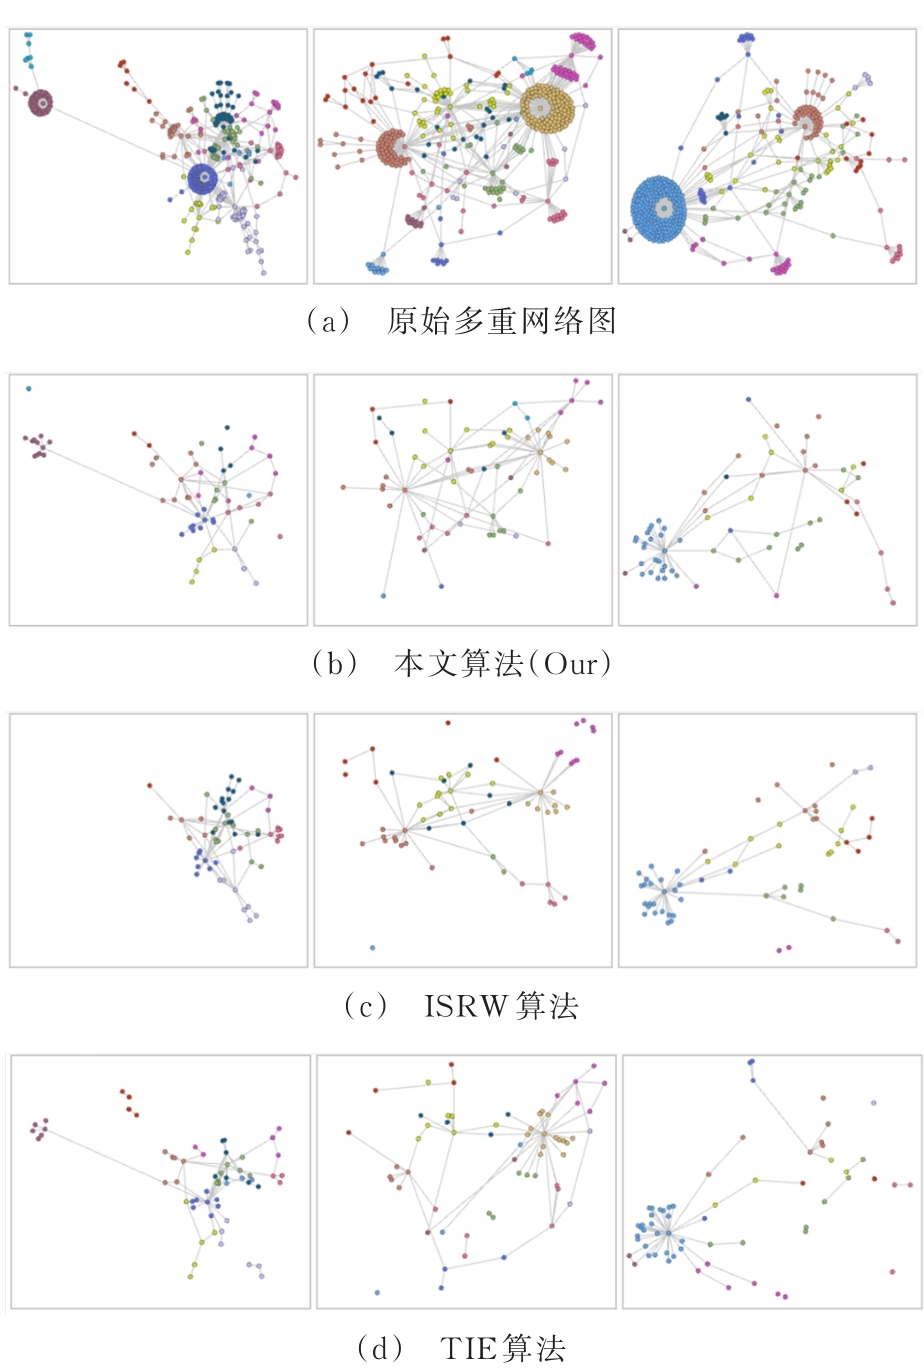
| 表征学习驱动的多重网络图采样 |
虞瑞麒1( ),刘玉华1(),沈禧龙2,翟如钰1,张翔2,周志光1 ),刘玉华1(),沈禧龙2,翟如钰1,张翔2,周志光1 |
1.杭州电子科技大学 数字媒体与艺术设计学院,浙江 杭州 310018
2.浙江财经大学 信息管理与人工智能学院,浙江 杭州 310018 |
|
| Representation learning driven multiple graph sampling |
| Ruiqi YU1(),Yuhua LIU1(),Xilong SHEN2,Ruyu ZHAI1,Xiang ZHANG2,Zhiguang ZHOU1 |
1.School of Media and Design,Hangzhou Dianzi University,Hangzhou 310018,China
2.School of Information Management and Artificial Intelligence,Zhejiang University of Finance and Economics,Hangzhou 310018,China |
引用本文:
虞瑞麒,刘玉华,沈禧龙,翟如钰,张翔,周志光. 表征学习驱动的多重网络图采样[J]. 浙江大学学报(理学版), 2022, 49(3): 271-279.
Ruiqi YU,Yuhua LIU,Xilong SHEN,Ruyu ZHAI,Xiang ZHANG,Zhiguang ZHOU. Representation learning driven multiple graph sampling. Journal of Zhejiang University (Science Edition), 2022, 49(3): 271-279.
链接本文:
https://www.zjujournals.com/sci/CN/10.3785/j.issn.1008-9497.2022.03.002
或
https://www.zjujournals.com/sci/CN/Y2022/V49/I3/271
|
| 1 |
ZHOU Z, SHI C, SHEN X, et al. Context-aware sampling of large networks via graph representation learning[J]. IEEE Transactions on Visualization and Computer Graphics, 2020, 27(2): 1709-1719. DOI:10.1109/TVCG.2020.3030440
doi: 10.1109/TVCG.2020.3030440
|
| 2 |
CHENG K. Sampling from large graphs with a reservoir[C]// Proceedings of the 2014 17th International Conference on Network-Based Information Systems. Los Alamitos: IEEE Computer Society Press, 2014: 347-354. DOI:10. 1109/NBiS.2014.25
doi: 10. 1109/NBiS.2014.25
|
| 3 |
MAGNANI M, ROSSI L. Formation of multiple networks[C]// International Conference on Social Computing, Behavioral-Cultural Modeling and Prediction. Berlin/Heidelberg: Springer, 2013: 257-264. DOI:10.1007/978-3-642-37210-0_28
doi: 10.1007/978-3-642-37210-0_28
|
| 4 |
SUN R, ZHANG L, CHEN Z. A sample-based approximate ranking method for large graphs[C]// 2018 6th International Conference on Advanced Cloud and Big Data(CBD). Los Alamitos: IEEE Computer Society Press, 2018: 112-117. DOI:10. 1109/CBD.2018.00029
doi: 10. 1109/CBD.2018.00029
|
| 5 |
TÜRKOGLU D, TURK A. Edge-based wedge sampling to estimate triangle counts in very large graphs[C]// 2017 IEEE International Conference on Data Mining(ICDM). Los Alamitos: IEEE Computer Society Press, 2017: 455-464. DOI:10. 1109/ICDM.2017.55
doi: 10. 1109/ICDM.2017.55
|
| 6 |
YOON S H, KIM K N, HONG J, et al. A community-based sampling method using DPL for online social networks[J]. Information Sciences, 2015, 306: 53-69. DOI:10.1016/j.ins. 2015.02.014
doi: 10.1016/j.ins. 2015.02.014
|
| 7 |
HU J, HONG S H, CHEN J, et al. Connectivity-based spectral sampling for big complex network visualization[C]// International Conference on Complex Networks and Their Applications. Cham: Springer, 2020: 237-248. DOI:10.1007/978-3-030-65347-7_20
doi: 10.1007/978-3-030-65347-7_20
|
| 8 |
ZHOU Z, MENG L, TANG C, et al. Visual abstraction of large scale geospatial origin-destination movement data[J]. IEEE Transactions on Visualization and Computer Graphics, 2018, 25(1): 43-53. DOI:10.1109/TVCG.2018.2864503
doi: 10.1109/TVCG.2018.2864503
|
| 9 |
GUO D, ZHU X. Origin-destination flow data smoothing and mapping[J]. IEEE Transactions on Visualization and Computer Graphics, 2014, 20(12): 2043-2052. DOI:10.1109/TVCG.2014. 2346271
doi: 10.1109/TVCG.2014. 2346271
|
| 10 |
ZHAO Y, JIANG H, CHEN Q, et al. Preserving minority structures in graph sampling[J]. IEEE Transactions on Visualization and Computer Graphics, 2020, 27(2): 1698-1708. DOI:10.1109/TVCG.2020.3030428
doi: 10.1109/TVCG.2020.3030428
|
| 11 |
MAIYA A S, BERGER-WOLF T Y. Benefits of bias: Towards better characterization of network sampling[C]// Proceedings of the 17th ACM SIGKDD International Conference on Knowledge Discovery and Data Mining. New York: ACM Press, 2011: 105-113. DOI:10.1145/2020408. 2020431
doi: 10.1145/2020408. 2020431
|
| 12 |
NGUYEN Q H, HONG S H, EADES P, et al. Proxy graph: Visual quality metrics of big graph sampling[J]. IEEE Transactions on Visualization and Computer Graphics, 2017, 23(6): 1600-1611. DOI:10.1109/TVCG.2017.2674999
doi: 10.1109/TVCG.2017.2674999
|
| 13 |
WU Y, CAO N, ARCHAMBAULT D, et al. Evaluation of graph sampling: A visualization perspective[J]. IEEE Transactions on Visualization and Computer Graphics, 2016, 23(1): 401-410. DOI:10.1109/TVCG.2016.2598867
doi: 10.1109/TVCG.2016.2598867
|
| 14 |
ZHANG F Y, ZHANG S, WONG P C, et al. A visual evaluation study of graph sampling techniques[J]. Electronic Imaging, 2017, 2017(1): 110-117. DOI:10.2352/ISSN.2470-1173.2017.1.VDA-394
doi: 10.2352/ISSN.2470-1173.2017.1.VDA-394
|
| 15 |
ZHANG D, YIN J, ZHU X, et al. Network representation learning: A survey[J]. IEEE Transactions on Big Data, 2020, 6(1): 3-28. DOI:10.1109/TBDATA.2018.2850013 .
doi: 10.1109/TBDATA.2018.2850013
|
| 16 |
PEROZZI B, AL-RFOU R, SKIENA S. Deepwalk: online learning of social representations[C]// Proceedings of the 20th ACM SIGKDD International Conference on Knowledge Discovery and Data Mining. New York: ACM Press, 2014: 701-710. DOI:10.1145/2623330.2623732
doi: 10.1145/2623330.2623732
|
| 17 |
GROVER A, LESKOVEC J. Node2vec: Scalable feature learning for networks[C]// Proceedings of the 22th ACM SIGKDD International Conference on Knowledge Discovery and Data Mining. New York: ACM Press, 2016: 855-864. DOI:10.1145/2939672.2939754
doi: 10.1145/2939672.2939754
|
| 18 |
WANG Y, CHEN L, JO J, et al. Joint t-SNE for comparable projections of multiple high-dimensional datasets[J]. IEEE Transactions on Visualization and Computer Graphics, 2022, 28(1): 623-632. DOI:10.1109/TVCG.2021.3114765 .
doi: 10.1109/TVCG.2021.3114765
|
|
Viewed |
|
|
|
Full text
|
|
|
|
|
Abstract
|
|
|
|
|
Cited |
|
|
|
|
| |
Shared |
|
|
|
|
| |
Discussed |
|
|
|
|