| 机械工程 |
|


|
|
|
| 不同采样密度下体压分布特征 |
赵川1( ),余隋怀1,*(),王磊2,李文华1 ),余隋怀1,*(),王磊2,李文华1 |
1. 西北工业大学 陕西省工业设计工程实验室,陕西 西安,710068
2. 中航工业第一飞机设计研究院,陕西 西安,710089 |
|
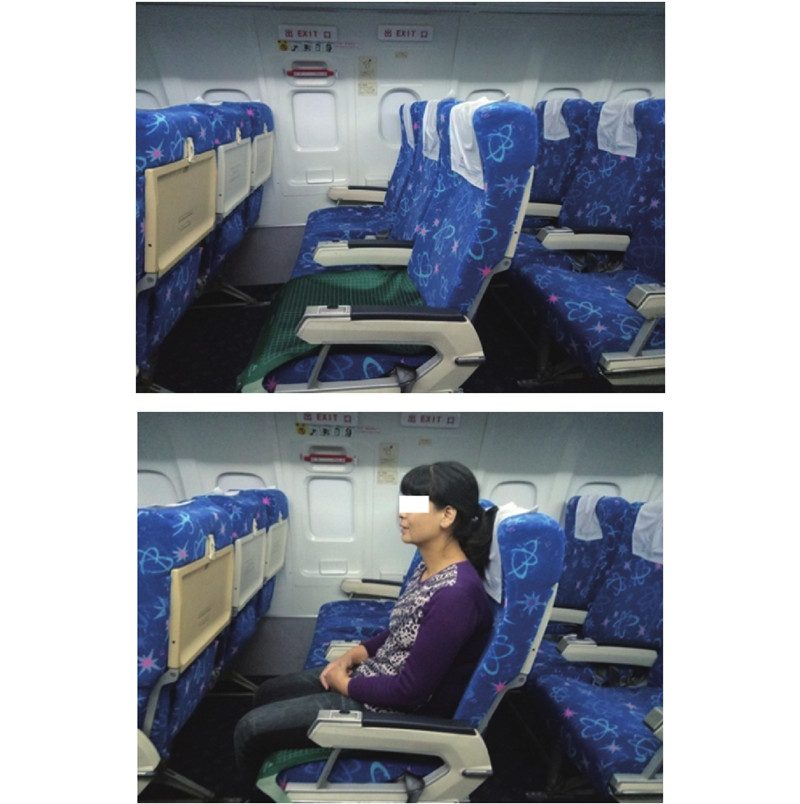
| Body pressure distribution characteristics in different sampling densities |
| Chuan ZHAO1(),Sui-huai YU1,*(),Lei WANG2,Wen-hua LI1 |
1. Shaanxi Engineering Laboratory for Industrial Design, Northwestern Polytechnical University, Xi'an 710072, China
2. China Aviation Industry First Aircraft Design Institute, Xi'an 710089, China |
引用本文:
赵川,余隋怀,王磊,李文华. 不同采样密度下体压分布特征[J]. 浙江大学学报(工学版), 2019, 53(2): 268-274.
Chuan ZHAO,Sui-huai YU,Lei WANG,Wen-hua LI. Body pressure distribution characteristics in different sampling densities. Journal of ZheJiang University (Engineering Science), 2019, 53(2): 268-274.
链接本文:
http://www.zjujournals.com/eng/CN/10.3785/j.issn.1008-973X.2019.02.009
或
http://www.zjujournals.com/eng/CN/Y2019/V53/I2/268
|
| 1 |
张毅, 王和平 民用客机总体方案评价准则研究[J]. 西北工业大学学报, 2006, 24 (6): 791- 794
ZHANG Yi, WANG He-ping Some suggesion evalution preliminary overall design of chinese passenger aircraft[J]. Journal of Northwestern Polytechnical University, 2006, 24 (6): 791- 794
doi: 10.3969/j.issn.1000-2758.2006.06.026
|
| 2 |
CILOGLU H, ALZIADEH M, MOHANY A, et al Assessment of the whole body vibration exposure and the dynamic seat comfort in passenger aircraft[J]. International Journal of Industrial Ergonomics, 2015, 45 (7): 116- 123
|
| 3 |
RICHARDS L G, JACOBSON I D, KUHLTHAU A R What the passenger contributes to passenger comfort[J]. Applied Ergonomics, 1978, 9 (3): 137- 142
doi: 10.1016/0003-6870(78)90003-0
|
| 4 |
VINK P. Aircraft interior comfort and design [M]. Boca Raton: CRC Press, 2011.
|
| 5 |
铃木浩明, 管永利 列车舒适度的评价[J]. 国外铁道车辆, 1999, (2): 26- 32
LINGMU hao-ming, GUAN Yong-li The evaluation of trian comfort[J]. Foreign Rolling Stock, 1999, (2): 26- 32
|
| 6 |
马佳, 柯艺杰, 苏强, 等 汽车座椅舒适度人工智能评价方法研究[J]. 机械科学与技术, 2011, 30 (3): 419- 422
MA Jia, KE Yi-jie, SU qiang, et al An automobile seat comfort evalution method based on artificial intelligence[J]. Mechanical Science and Technology for Aerospace Engineering, 2011, 30 (3): 419- 422
|
| 7 |
LAI Y H, SUE M W, GUO L Y A novel evaluation platform for the evaluation of anti-ulcers mattress[J]. Gerontechnology, 2014, 13 (2): 232
|
| 8 |
ANDRADE Y N. An ergonomic evaluation of aircraft pilot seats [D]. Daytona Beach: Embry Riddle Aeronautical University, 2013.
|
| 9 |
CIACCIA F R D A S, SZNELWAR L I An approach to aircraft seat comfort using interface pressure mapping[J]. Work, 2012, 41 (Suppl. 1): 240- 245
|
| 10 |
LI W, YU S, YANG H, et al Effects of long-duration sitting with limited space on discomfort, body flexibility, and surface pressure[J]. International Journal of Industrial Ergonomics, 2017, 58: 12- 24
doi: 10.1016/j.ergon.2017.01.002
|
| 11 |
STINSON M D, PORTER-ARMSTRONG A, EAKIN P Seat-interface pressure: a pilot study of the relationship to gender, body mass index, and seating position[J]. Archives of Physical Medicine and Rehabilitation, 2003, 84 (3): 405- 409
doi: 10.1053/apmr.2003.50011
|
| 12 |
VOS G A, CONGLETON J J, MOORE J S, et al Postural versus chair design impacts upon interface pressure[J]. Applied Ergonomics, 2006, 37 (5): 619- 628
doi: 10.1016/j.apergo.2005.09.002
|
| 13 |
KOLICH M, SEAL N, TABOUN S Automobile seat comfort prediction: statistical model vs artificial neural network[J]. Applied Ergonomics, 2004, 35 (3): 275- 284
doi: 10.1016/j.apergo.2004.01.007
|
| 14 |
ZHAO C, YU S, MILLER C, et al. Predicting aircraft seat comfort using an artificial neural network [J/OL]. Human Factors and Ergonomics in Manufacturing and Service Industries. https://onlinelibrary.wiley.com/doi/full/10.1002/hfm.20767.
|
| 15 |
TIMM M, SAMUELSSON K Wheelchair seating: a study on the healthy elderly[J]. Scandinavian Journal of Occupational Therapy, 2016, 23 (6): 458- 466
doi: 10.3109/11038128.2016.1152297
|
| 16 |
VERBUNT M, BARTNECK C Sensing senses: tactile feedback for the prevention of decubitus ulcers[J]. Applied Psychophysiology and Biofeedback, 2010, 35 (3): 243- 250
doi: 10.1007/s10484-009-9124-z
|
| 17 |
WININGER M, CRANE B A Assessment of the minimally sufficient spatial sampling in pressure mapping the wheelchair seating interface[J]. Technology and Disability, 2015, 27 (4): 119- 125
|
| 18 |
HEFFERNAN C, FREIVALDS A Optimum pinch grips in the handling of dies[J]. Applied Ergonomics, 2000, 31 (4): 409- 414
doi: 10.1016/S0003-6870(99)00064-2
|
| 19 |
KREMSER F, GUENZKOFER F, SEDLMEIER C, et al Aircraft seating comfort: the influence of seat pitch on passengers’ well-being[J]. Work, 2012, 41 (Suppl. 1): 4936- 4942
|
|
Viewed |
|
|
|
Full text
|
|
|
|
|
Abstract
|
|
|
|
|
Cited |
|
|
|
|
| |
Shared |
|
|
|
|
| |
Discussed |
|
|
|
|