|
|
A Visual Analytics System to Support the Formation of a Hypothesis from Calcium Waves Data
KozenUmezawa, HiroakiNatsukawa, YosukeOnoue, KojiKoyamada
Vis Inf, 2018, 2(1): 2-13.
https://doi.org/10.1016/j.visinf.2018.04.002
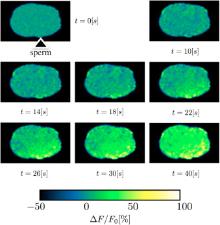
In most species, calcium waves in the oocyte are considered common phenomena in the activation of eggs. However, the mechanism of calcium waves has not yet been clarified. By collaborating with biologists studying Caenorhabditis elegans (C. elegans), which is widely used as a model organism, we observed that the following requirements must be satisfied to form a useful hypothesis based on calcium waves captured using high-speed in vivo imaging: (1) the ability to obtain an overview of how the calcium waves are propagated and (2) the ability to understand the propagation of waves in a narrow region. However, conventional visualization methods cannot satisfy these requirements simultaneously. Therefore, we propose a visual analytics system that allows users to understand and explore calcium wave images using cross-correlation analysis of the time-series data of the Ca2+ fluorescence intensity at each point. The interface of this system comprises an overview visualization, a detail visualization, and user interactions to satisfy these requirements and realize exploratory visualization. Some views present an overview visualization that displays the clustering results of a directed graph calculated using cross-correlation analysis. These views enable the users to understand the overview of wave propagation, thereby helping users find a region of interest. The detail visualization shows the relationship between the region of interest and other areas. Furthermore, users can use the proposed system with overview-detail and brush-link exploration to assign meaning to the region of interest and construct a hypothesis for its role. In this paper, we demonstrate how the proposed visual analytics approach works and how new hypotheses can be formed using the analysis of C. elegans calcium waves.
|
|
|
MultiSciView: Multivariate Scientific X-ray Image Visual Exploration with Cross-Data Space Views
WenZhong, WeiXu, KevinG.Yager, GregoryS.Doerk, JianZhao, YunkeTiae, SungsooHa, CongXie, YuanZhong, KlausMueller, Kerstin KleeseVan Dam
Vis Inf, 2018, 2(1): 14-25.
https://doi.org/10.1016/j.visinf.2018.04.003
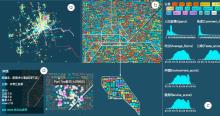
X-ray images obtained from synchrotron beamlines are large-scale, high-resolution and high-dynamic-range grayscale data encoding multiple complex properties of the measured materials. They are typically associated with a variety of metadata which increases their inherent complexity. There is a wealth of information embedded in these data but so far scientists lack modern exploration tools to unlock these hidden treasures. To bridge this gap, we propose MultiSciView, a multivariate scientific x-ray image visualization and exploration system for beamline-generated x-ray scattering data. Our system is composed of three complementary and coordinated interactive visualizations to enable a coordinated exploration across the images and their associated attribute and feature spaces. The first visualization features a multi-level scatterplot visualization dedicated for image exploration in attribute, image, and pixel scales. The second visualization is a histogram-based attribute cross filter by which users can extract desired subset patterns from data. The third one is an attribute projection visualization designed for capturing global attribute correlations. We demonstrate our framework by ways of a case study involving a real-world material scattering dataset. We show that our system can efficiently explore large-scale x-ray images, accurately identify preferred image patterns, anomalous images and erroneous experimental settings, and effectively advance the comprehension of material nanostructure properties.

|
|
|
An Uncertainty-aware Workflow for Keyhole Surgery Planning using Hierarchical Image Semantics
Christina Gillmann, Robin G.C. Maack, Tobias Post, Thomas Wischgoll, Hans Hagen
Vis Inf, 2018, 2(1): 26-36.
https://doi.org/10.1016/j.visinf.2018.04.004
Keyhole surgeries become increasingly important in clinical daily routine as they help minimizing the damage of a patient’s healthy tissue. The planning of keyhole surgeries is based on medical imaging and an important factor that influences the surgeries’ success. Due to the image reconstruction process, medical image data contains uncertainty that exacerbates the planning of a keyhole surgery. In this paper we present a visual workflow that helps clinicians to examine and compare different surgery paths as well as visualizing the patients’ affected tissue. The analysis is based on the concept of hierarchical image semantics, that segment the underlying image data with respect to the input images’ uncertainty and the users understanding of tissue composition. Users can define arbitrary surgery paths that they need to investigate further. The defined paths can be queried by a rating function to identify paths that fulfill user-defined properties. The workflow allows a visual inspection of the affected tissues and its substructures. Therefore, the workflow includes a linked view system indicating the three-dimensional location of selected surgery paths as well as how these paths affect the patients tissue. To show the effectiveness of the presented approach, we applied it to the planning of a keyhole surgery of a brain tumor removal and a kneecap surgery.

|
|
|
MessageLens: A Visual Analytics System to Support Multifaceted Exploration of MOOC Forum Discussions
Jian-Syuan Wong, Xiaolong “Luke” Zhang
Vis Inf, 2018, 2(1): 37-49.
https://doi.org/10.1016/j.visinf.2018.04.005
Massive Open Online Courses (MOOCs) often provide online discussion forum tools to facilitate learner interaction and communication. Having massive forum messages posted by learners everyday, MOOC forums are regarded as an important source for understanding learners activities and opinions. However, the high volume and heterogeneity of MOOC forum contents make it challenging to analyze forum data effectively from different perspectives of discussions and to integrate diverse information into a coherent understanding of issues of concern. In this paper, we report a study on the design of a visual analytics tool to facilitate the multifaceted analysis of online discussion forums. This tool, called MessageLens, aims at helping MOOC instructors to gain a better understanding of forum discussions from three facets: discussion topic, learner attitude, and communication among learners. With various visualization tools, instructors can investigate learner activities from different perspectives. We report a case study with real-world MOOC forum data to present the features of MessageLens and a preliminary evaluation study on the benefits and areas of improvement of the system . Our research suggests an approach to analyzing rich communication contents as well as dynamic social interactions among people.

|
|
|
Metro-Wordle: An Interactive Visualization for Urban Text Distributions Based on Wordle
Vis Inf, 2018, 2(1): 50-59.
https://doi.org/10.1016/j.visinf.2018.04.006
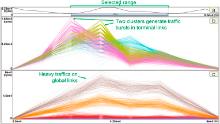
With the development of cities and the explosion of information, vast amounts of geo-tagged textural data about Points of Interests (POIs) have been generated. Extracting useful information and discovering text spatial distributions from the data are challenging and meaningful. Also, the huge numbers of POIs in modern cities make it important to have efficient approaches to retrieve and choose a destination. This paper provides a visual design combing metro map and wordles to meet the needs. In this visualization, metro lines serve as the divider lines splitting the city into several subareas and the boundaries to constrain wordles within each subarea. The wordles are generated from keywords extracted from the text about POIs (including reviews, descriptions, etc.) and embedded into the subareas based on their geographical locations. By generating intuitive results and providing an interactive visualization to support exploring text distribution patterns, our strategy can guide the users to explore urban spatial characteristics and retrieve a location efficiently. Finally, we implement a visual analysis of the restaurants data in Shanghai, China as a case study to evaluate our strategy.
|
|
|
TideGrapher: Visual Analytics of Tactical Situations for Rugby Matches
Yusuke Ishikawa, Issei fujishiro
Vis Inf, 2018, 2(1): 60-70.
https://doi.org/10.1016/j.visinf.2018.04.007
Various attempts at exploiting information visualization for sports have recently been reported in the literature, although it is still challenging to analyze continuous ball matches. In this paper, we propose a novel visual analytics system, called TideGrapher, to track the transition of tactile situations in a rugby match. With a particular focus on the side position of the ball, we designed a dedicated spatial substrate based on the spatio-temporal trajectory of the ball and provided a set of basic interactions. Quantitative analysis was strengthened by adding a new index, called initiative, to commonly used possession (ball occupation) and territory (dominance of territory). The feasibility of the proposed visual analytics system was proven empirically through application to datasets from real amateur and professional
|
|
|
VisComposer: A Visual Programmable Composition Environment for Information Visualization
Honghui Mei, Wei Chen, Yuxin Ma, HuihuaGua, Wanqi Hu
Vis Inf, 2018, 2(1): 71-81.
https://doi.org/10.1016/j.visinf.2018.04.008
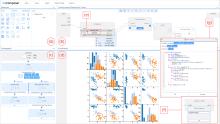
As the amount of data being collected has increased, the need for tools that can enable the visual exploration of data has also grown. This has led to the development of a variety of widely used programming frameworks for information visualization. Unfortunately, such frameworks demand comprehensive visualization and coding skills and require users to develop visualization from scratch. An alternative is to create interactive visualization design environments that require little to no programming. However, these tools only supports a small portion of visual forms. We present a programmable integrated development environment (IDE), VisComposer, that supports the development of expressive visualization using a drag-and-drop visual interface. VisComposer exposes the programmability by customizing desired components within a modularized visualization composition pipeline, effectively balancing the capability gap between expert coders and visualization artists. The implemented system empowers users to compose comprehensive visualizations with real-time preview and optimization features, and supports prototyping, sharing and reuse of the effects by means of an intuitive visual composer. Visual programming and textual programming integrated in our system allow users to compose more complex visual effects while retaining the simplicity of use. We demonstrate the performance of VisComposer with a variety of examples and an informal user evaluation.
|
|
|
LongLine: Visual Analytics System for Large-scale Audit Logs
Seunghoon Yoo, Jaemin Jo, Bohyoung Kim, Jinwook Seo
Vis Inf, 2018, 2(1): 82-97.
https://doi.org/10.1016/j.visinf.2018.04.009
Audit logs are different from other software logs in that they record the most primitive events (i.e., system calls) in modern operating systems. Audit logs contain a detailed trace of an operating system, and thus have received great attention from security experts and system administrators. However, the complexity and size of audit logs, which increase in real time, have hindered analysts from understanding and analyzing them. In this paper, we present a novel visual analytics system, LongLine, which enables interactive visual analyses of large-scale audit logs. LongLine lowers the interpretation barrier of audit logs by employing human-understandable representations (e.g., file paths and commands) instead of abstract indicators of operating systems (e.g., file descriptors) as well as revealing the temporal patterns of the logs in a multi-scale fashion with meaningful granularity of time in mind (e.g., hourly, daily, and weekly). LongLine also streamlines comparative analysis between interesting subsets of logs, which is essential in detecting anomalous behaviors of systems. In addition, LongLine allows analysts to monitor the system state in a streaming fashion, keeping the latency between log creation and visualization less than one minute. Finally, we evaluate our system through a case study and a scenario analysis with security experts.

|
|
|
A visual analytics system for optimizing the performance of large-scale networks in supercomputing systems
TakanoriFujiwara, JianpingKelvinLi, MisbahMubarak, CaitlinRoss, Christopher D.Carothers, Robert B.Ross, Kwan-LiuMa
Vis Inf, 2018, 2(1): 98-110.
https://doi.org/10.1016/j.visinf.2018.04.010
The overall efficiency of an extreme-scale supercomputer largely relies on the performance of its network interconnects. Several of the state of the art supercomputers use networks based on the increasingly popular Dragonfly topology. It is crucial to study the behavior and performance of different parallel applications running on Dragonfly networks in order to make optimal system configurations and design choices, such as job scheduling and routing strategies. However, in order to study these temporal network behavior, we would need a tool to analyze and correlate numerous sets of multivariate time-series data collected from the Dragonfly’s multi-level hierarchies. This paper presents such a tool–a visual analytics system–that uses the Dragonfly network to investigate the temporal behavior and optimize the communication performance of a supercomputer. We coupled interactive visualization with time-series analysis methods to help reveal hidden patterns in the network behavior with respect to different parallel applications and system configurations. Our system also provides multiple coordinated views for connecting behaviors observed at different levels of the network hierarchies, which effectively helps visual analysis tasks. We demonstrate the effectiveness of the system with a set of case studies. Our system and findings can not only help improve the communication performance of supercomputing applications, but also the network performance of next-generation supercomputers.
|
9 articles
|